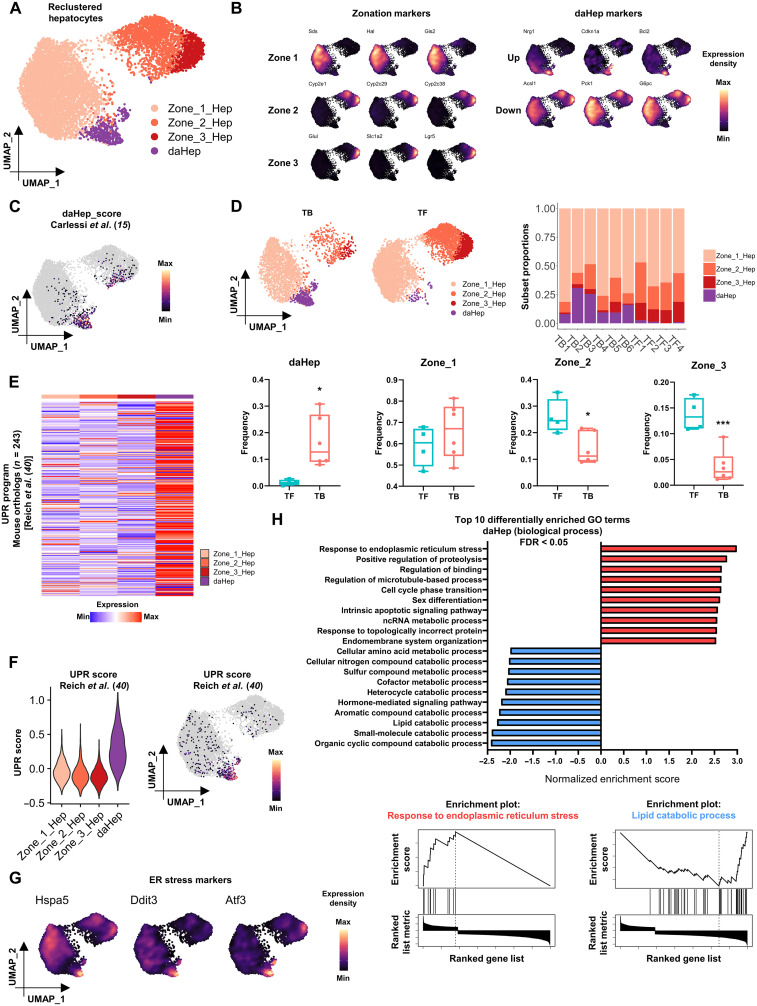
Fig. 1. daHeps are enriched in NASH before HCC and characterized by the exacerbated ER stress–related gene expression program.
(A) Uniform manifold approximation and projection (UMAP) visualization of reclustered hepatocytes. Four subsets identified representing hepatocyte zonation phenotypes (Zone_1_Hep, Zone_2_Hep, and Zone_3_Hep) and daHep. (B) Expression distribution of (left) zonation marker genes and (right) up-regulated and down-regulated daHep markers in the UMAP space. (C) Mapping of daHep scores generated from Carlessi et al. (15) onto the reclustered hepatocytes UMAP. (D) (Top left) Hepatocytes UMAP visualization split by HCC outcome at 40 weeks (TB, tumor-bearing; TF, tumor-free). (Top right) Relative frequencies of hepatocyte subsets in each sample. (Bottom) Box and whisker plots showing frequencies of each hepatocyte subset according to HCC outcome. *P < 0.05, ***P < 0.01 by unpaired t test, TF, n = 4 and TB, n = 6. (E) Heatmap showing average expression of 243 mouse orthologs of human UPR program from Reich et al. (40) across hepatocyte subsets. (F) Mapping of UPR scores generated from Reich et al. (40) across hepatocyte subsets: (left) violin plot and (right) UMAP visualization. (G) Expression distribution of ER stress markers in the UMAP space, showing high levels where daHep cells localize. (H) (Top) GSEA of log2FC ranked daHep DEGs showing the top 10 over- and underrepresented gene ontology (biological process) terms. (Bottom) Enrichment plots for “response to ER stress” and “lipid catabolic process” gene sets.

