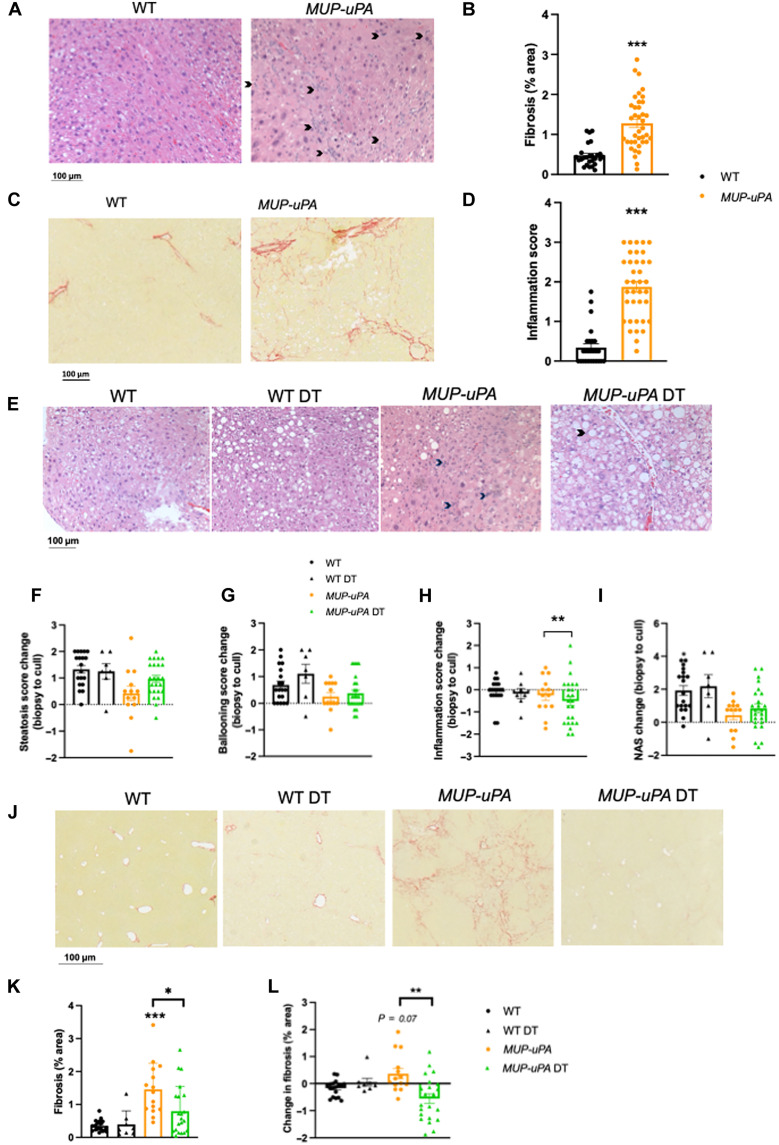
Fig. 6. Treatment with BGP-15 and sgp130Fc after NASH onset results in disease regression.
WT and MUP-uPA mice were untreated or treated with BGP-15 [in drinking water and sgp130Fc (twice weekly injections of 0.5 mg/kg)] for 11 weeks (DT). Representative images of H&E (A) and Picosirus Red (PSR) (C) and quantification of fibrosis (B) and lobular inflammation (D) in WT and MUP-uPA mice at 12 weeks before DT or placebo treatment. Representative images of H&E (E) and quantification steatosis (F), ballooning hepatocytes (G), lobular inflammation (H), and NAS (I) in WT and MUP-uPA mice either untreated or DT. The NAS is a measure of grade and is the sum of numerical scores applied to steatosis, hepatocellular ballooning, and lobular inflammation. Data in (F) to (I) represent the change in score from biopsy (pre-treatment) to cull (post-treatment). Representative PSR images (J) and quantification of % fibrosis (K) and change in fibrosis area (pre-post treatment) (L) in WT, MUP-uPA, and MUP-uPA/sgp130 BGP-15–treated mice. (B) and (D), unpaired t tests; (F) to (I), (K), and (L), one-way ANOVA with Tukey’s multiple comparisons where indicated. The following numbers of biological replicates were used (independent mice) per group in each experiment: (B and D) 26 to 38; (F to I) 7 to 24; (K and L) 8 to 22. Data are expressed as means ± SEM. *P < 0.05, **P < 0.01, ***P < 0.001. In (L), P = 0.07 relative to WT DT.

