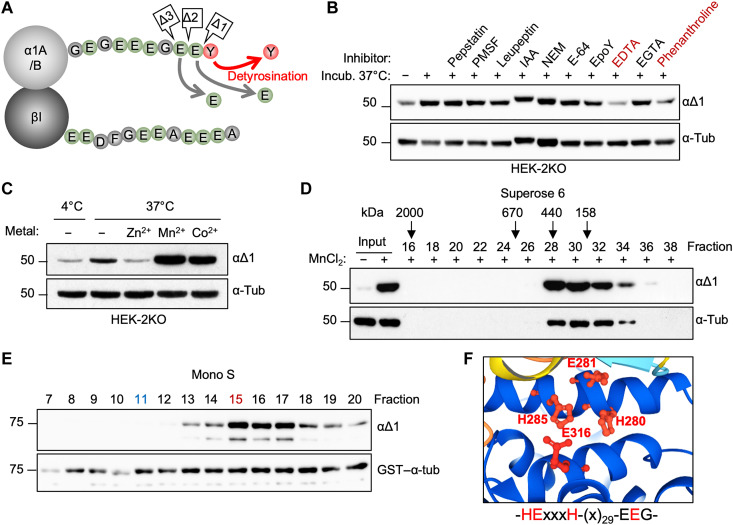
Fig. 1. Purification and identification of α-tubulin detyrosinase.
(A) Schematic representation of the known α-tubulin C-terminal cleavages, which generate detyrosinated (αΔ1), αΔ2-, and αΔ3-tubulins. (B) Immunoblots of an in vitro assay testing the effect of inhibitors specific to different types of proteases on the endogenous detyrosinase activity from HEK-2KO cells. PMSF, phenylmethylsulfonyl fluoride; IAA, iodoacetamide; NEM, N-ethylmaleimide. (C) Immunoblot of an in vitro assay testing the effect of different metal ions on the endogenous detyrosinase activity from HEK-2KO cells. (D) Immunoblots of detyrosinase activity in different fractions following gel filtration assayed on endogenous tubulin. Fraction numbers and molecular mass standards used to calibrate the column are indicated on the top. (E) Immunoblots of detyrosinase activity in different fractions after cation-exchange chromatography (Mono S) of the enriched detyrosinase activity after the first step of purification. The activity was measured against recombinant GST–α-tubulin, which was added to each fraction. Fractions 11 (blue) and 15 (red) were subjected to mass spectrometry analysis as a negative and positive fraction, respectively. (F) AlphaFold-based prediction of the putative active site of KIAA0895L.

