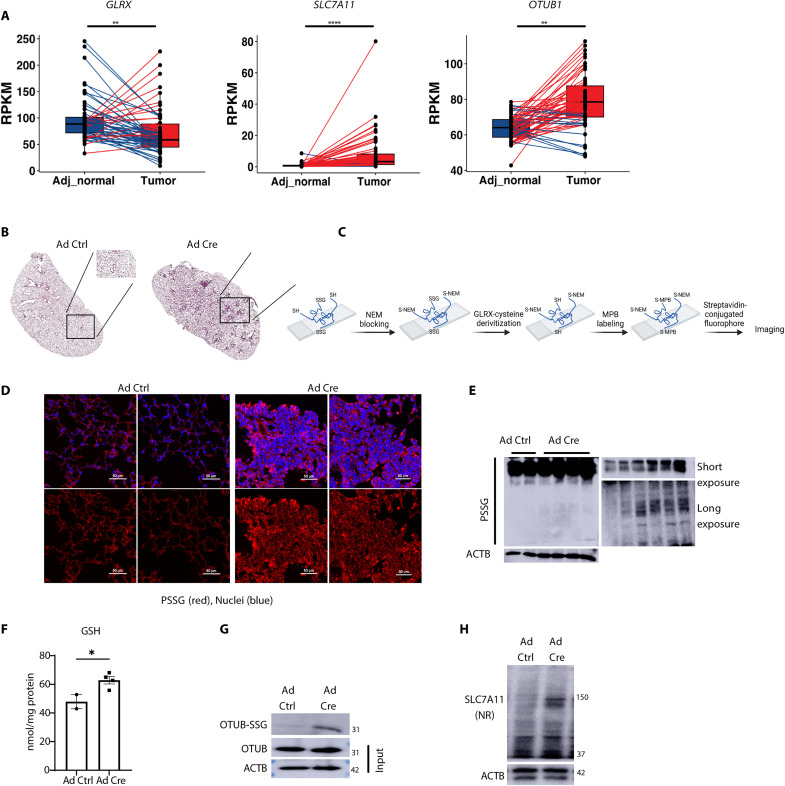
Fig. 9. Altered expression of GLRX, SLC7A11, and OTUB1 in LUAD.
(A) Assessment of GLRX, SLC7A11, and OTUB1 in 58 LUADs (tumor) compared with matched adjacent normal lung tissue from the TCGA database. Lines connect matched samples from individual patients (adjacent normal to tumor). Blue lines indicate decreased expression, while red represents increased expression in LUAD compared to adjacent normal tissue. RPKM, reads per kilobase of transcript per million mapped reads. (B) Hematoxylin and eosin staining of tissue sections derived from lungs of mice expressing KrasLoxP-Stop-LoxP(LSL)-G12D/WT 15 weeks after the administration of adenovirus expressing Cre recombinase (Ad Cre; right) or control virus (Ad Ctrl; left). (C) Schematic of GLRX-based cysteine derivatization used in (D). MPB, 3-(N-maleimido-propionyl) biocytin; NEM, N-ethylmaleimide. (D) PSSG staining (in red) in lung sections from mice treated with Ad Ctrl (left) or Ad Cre (right). Ad Cre images represent tumor areas selected on the basis of morphology. The figure was created using Biorender.com. (E) Total PSSG in lung lysates detected by Western blotting. The top right blot shows the PSSG bands of the left blot under short exposure. The bottom right blot shows the PSSG bands of lower region of the left blot after long exposure. (F) Total GSH levels in lung lysates of mice treated with Ad ctrl or Ad cre. (G) Immunoprecipitation of glutathionylated proteins via GSH antibody followed by Western blot analysis of OTUB1 to detect OTUB-SSG (top). OTUB1 and ACTB from total cell lysates were used as input controls. (H) Nonreducing Western blotting for SLC7A11. ACTB, loading control. *P < 0.05,**P < 0.01, and ****P < 0.0001.

