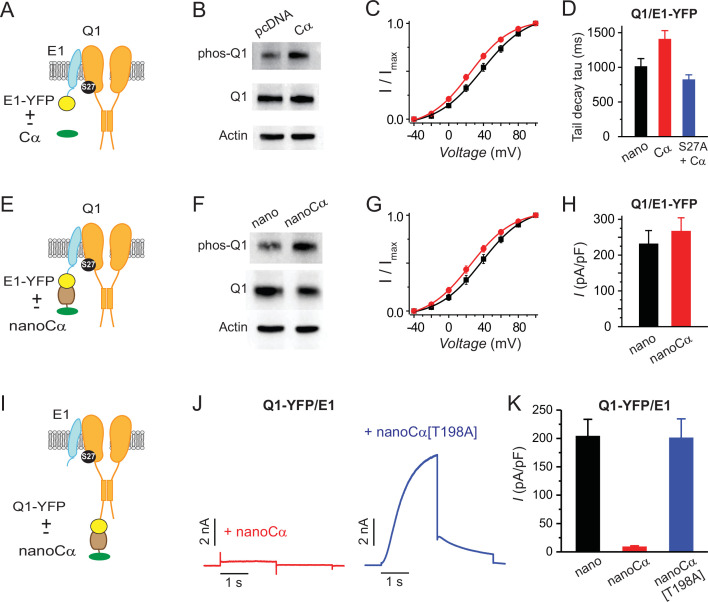
Figure 2. Differential functional effects of nano-Cα targeted to either Q1 or E1 on IKs.
(A) Cartoon showing Q1/E1-YFP complex co-expressed with or without free protein kinase A (PKA) Cα subunit. (B) Representative immunoblots of lysates from HEK293 cells co-expressing Q1/E1-YFP with either empty pcDNA3.1 vector or free Cα. Anti-pKCNQ1 (top) detects phosphorylated KCNQ1-S27, anti-KCNQ1 (middle) detects total KCNQ1, and anti-actin (bottom) detects total actin. N=1. (C) IKs activation curves in Chinese hamster ovary (CHO) cells co-expressing Q1, E1-YFP with either empty pcDNA3.1 vector (black symbols, n=13) or free PKA Cα (red symbols, n=13). (D) Tail-decay times for currents recorded from cells co-expressing Q1/E-YFP+yotiao and either nano or free PKA Cα, or cells co-expressing Q1[S27A]/E1-YFP+yotiao and free PKA Cα (p=0.0532, one-way ANOVA). (E–H) Cartoon, immunoblots, IKs activation curves, and population current densities of Q1/E1-YFP complex expressed with either nano (n=10) or nanoCα (n=10). (I) Cartoon showing targeting of nanoCα to Q1/E1 complex via YFP tag on Q1 C-terminus. (J) Exemplar IKs traces from CHO cells co-expressing Q1-YFP/E1 with either nanoCα (left) or catalytically inactive nanoCα [T198A] mutant (right). (K) Population current densities (nano, n=26; nanoCα, n=19; nanoCα[T198A], n=10).


