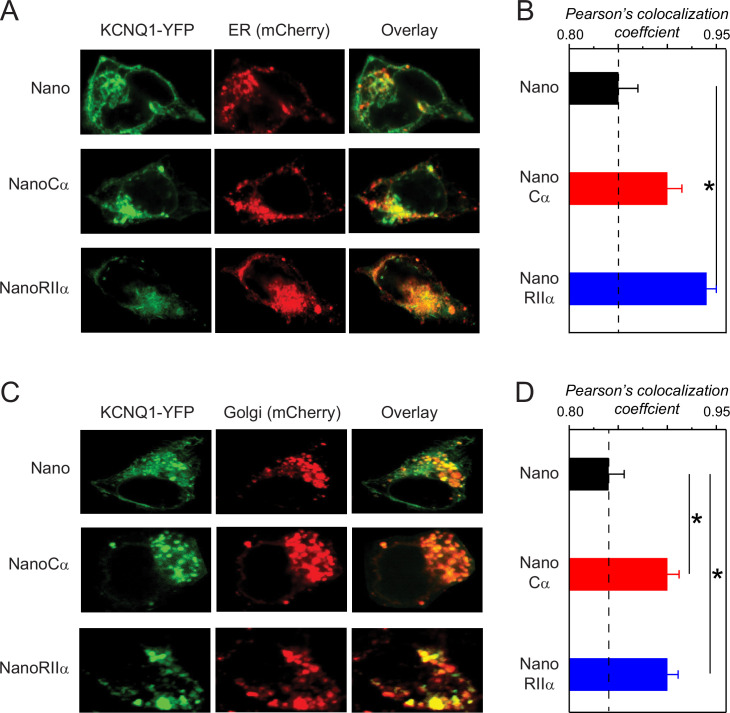
Figure 4. Subcellular localization of KCNQ1 tethered to nano, nanoCα, or nanoRIIα.
(A) Representative confocal images of HEK293 cells expressing Q1-YFP/E1 and ER-mCherry marker with nano, nanoCα, or nanoRIIα. (B) Co-localization of Q1-YFP with ER-mCherry assessed by Pearson’s co-localization coefficient; n=9 for nano, n=7 for nanoCα and n=8 for nanoRIIα. (C) Representative confocal images of HEK293 cells expressing Q1-YFP/E1 and Golgi-mCherry marker with nano, nanoCα, or nanoRIIα. (D) Co-localization of Q1-YFP with ER-mCherry assessed by Pearson’s co-localization coefficient; n=9 for nano, n=8 for nanoCα, and n=6 for nanoRIIα. *p<0.05, one-way ANOVA and Tukey HSD post hoc test.

