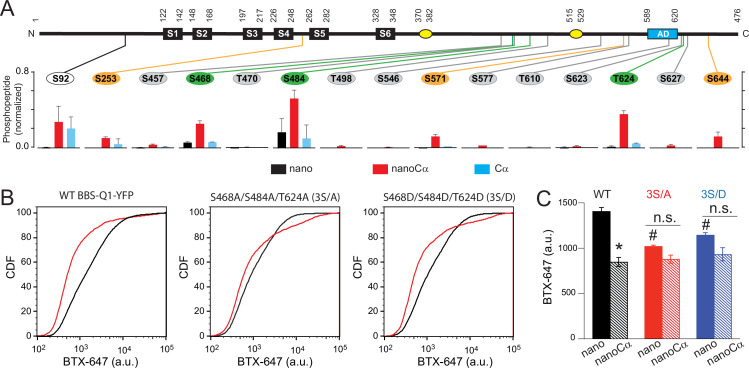
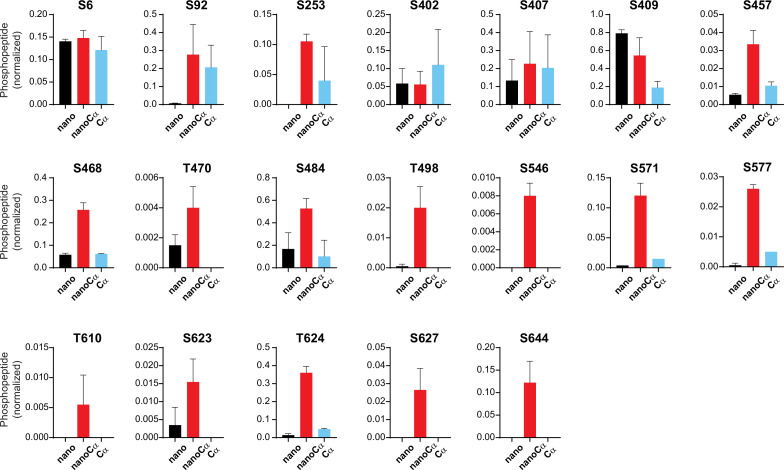
Figure 6. Potential phosphorylation sites involved in protein kinase A (PKA) modulation of KCNQ1 trafficking.
(A) Top, schematic of Q1 showing positions of Ser and Thr residues where phosphorylation was increased when nanoCα was targeted to Q1 C-terminus. Bottom, relative abundance of phosphorylated KCNQ1-YFP peptides identified using mass spectrometry in cells co-expressing nano (black), nanoCα (red), or free Cα (cyan). (B) Exemplar CDF plots showing channel surface density in cells expressing WT BBS-Q1-YFP (left), BBS-3S/A-YFP (middle), or BBS-3S/D-YFP (right) in the absence (black traces) or presence (red traces) of nanoCα. (C) Channel surface density (mean BTX-647 fluorescence in YFP-positive cells) in cells expressing WT BBS-Q1-YFP, BBS-3S/A-YFP, or BBS-3S/D-YFP in the presence of either nano or nanoCα. WT BBS-Q1-YFP (nano, N=4; nanoCα, N=4; *p<0.001, unpaired t-test). BBS-3S/A-YFP (nano, N=4; nanoCα, N=4; p=0.063, unpaired t-test). BBS-3S/D-YFP (nano, N=4; nanoCα, N=4; p=0.079, unpaired t-test). #p<0.001 compared to WT+nano, one-way ANOVA and Tukey HSD post hoc test.


