Figure 5.
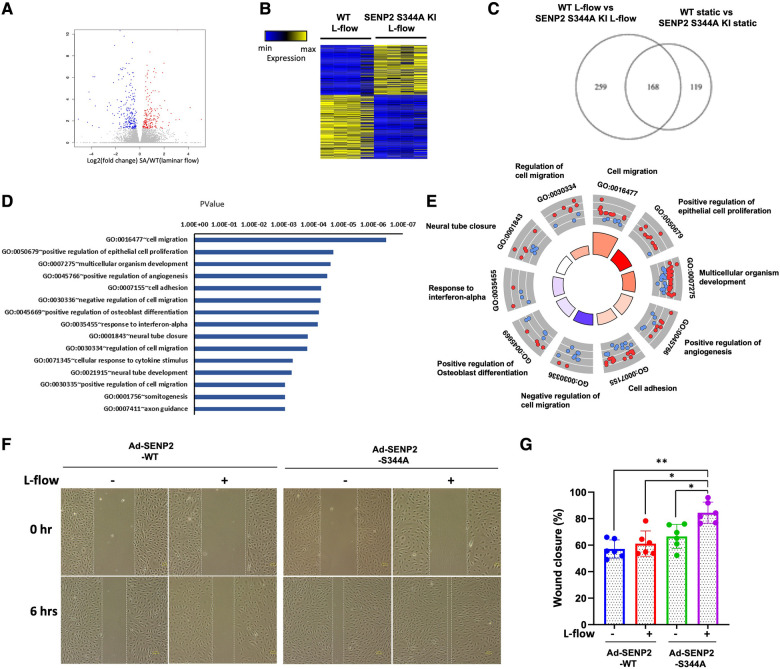
Increased EC pathophysiological stress response in SENP2 S344A KI MLECs: (A) the volcano plot illustrates the differentially expressed genes (DEGs) in WT MLECs compared to SENP2 S344A KI MLECs after L-flow; “red” dots represent upregulated DEGs, and “blue” dots represent downregulated DEGs. (B) A heatmap displaying hierarchical clustering of DEGs between WT MLECs vs. SENP2 S344A KI MLECs after L-flow for 24 h. (C) A Venn diagram indicating the total number of DEGs in WT MLECs and SENP2 S344A KI MLECs. (D) Annotation of EC activation-related gene ontology (GO) pathways identified in quadruplicate between WT MLECs vs. SENP2 S344A KI MLECs. (E) A molecular function Chord plot illustrating the enriched GO biological process terms associated with EC activation in SENP2 S344A KI MLEC transcripts, along with the corresponding genes arranged by their expression levels. (F) HUVECs transduced with Ad-SENP2 WT or Ad-SENP2 S344A were subjected to a scratch assay and exposed to L-flow for 6 h. Representative images of cell migration are shown. The dashed line represents the initial or final migration areas. (G) The graphs present quantified data from 6 independent experiments (*p < 0.05, **p < 0.01, two-way ANOVA).

