
FIGURE 2.
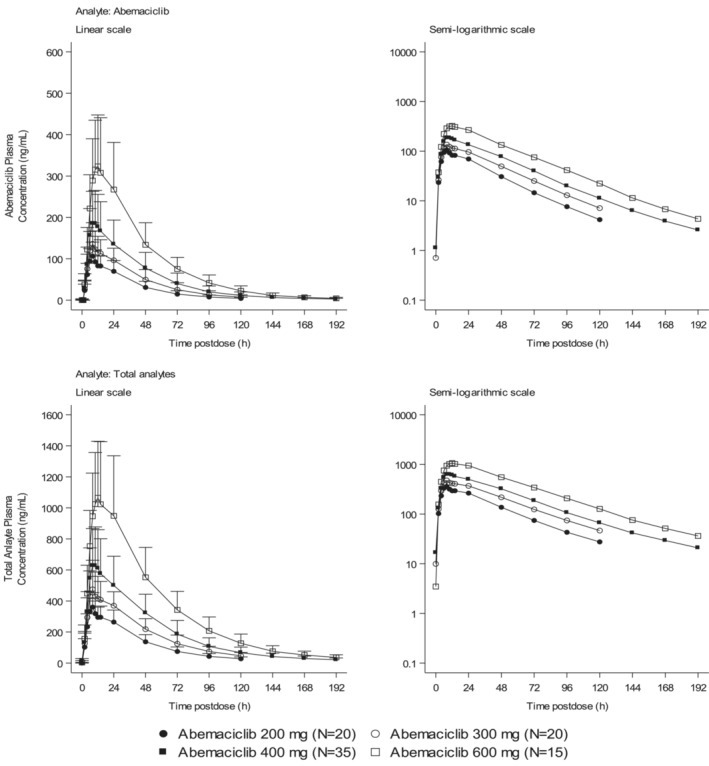
Arithmetic mean of plasma abemaciclib and total analyte (abemaciclib, M2, and M20) concentration versus time profiles following single oral doses of 200–600 mg abemaciclib in healthy participants. Values are ± standard deviation.
Official websites use .gov
A
.gov website belongs to an official
government organization in the United States.
Secure .gov websites use HTTPS
A lock (
) or https:// means you've safely
connected to the .gov website. Share sensitive
information only on official, secure websites.
Arithmetic mean of plasma abemaciclib and total analyte (abemaciclib, M2, and M20) concentration versus time profiles following single oral doses of 200–600 mg abemaciclib in healthy participants. Values are ± standard deviation.