
FIGURE 2.
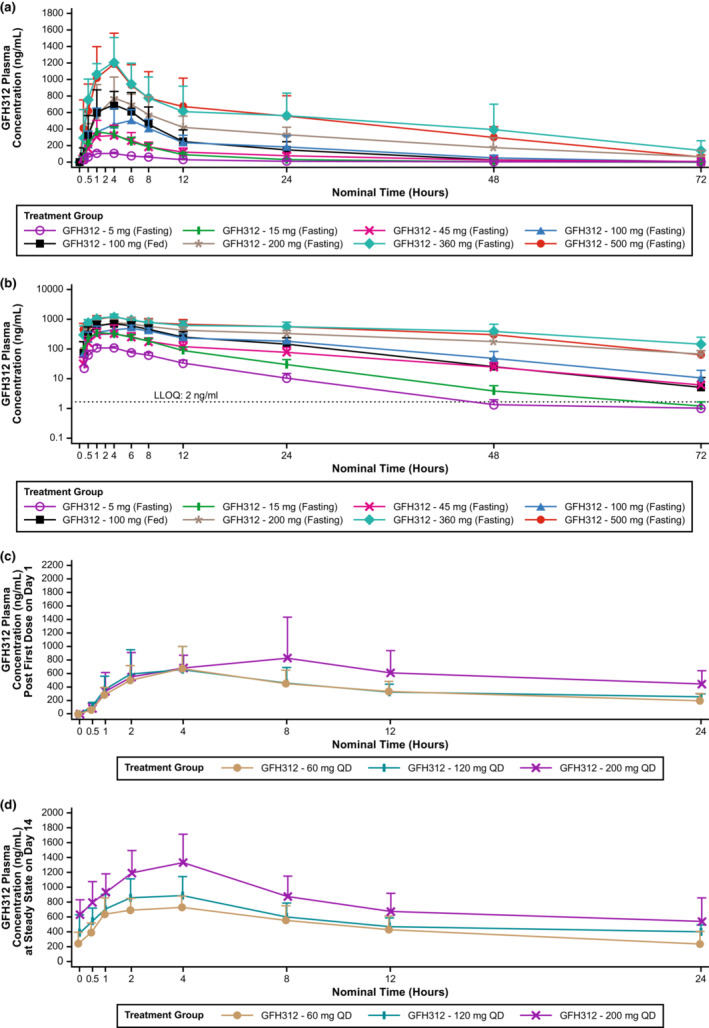
Plasma concentration over time for GFH312. (a) Plasma concentration after a single dose of GFH312 in part I, linear scale. (b) Plasma concentration after a single dose of GFH312 in part I, log scale. (c) Plasma concentration after the first dose of GFH312 in part II. (d) Plasma concentration of GFH312 at steady‐state on day 14 in part II. LLOQ, lower limit of quantification; QD, once daily.