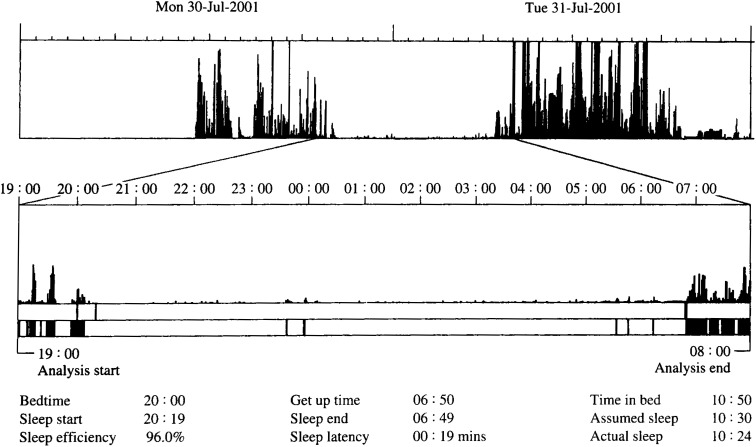
Figure 1. A representative actogram obtained from a subject.
A representative actogram obtained from a subject is shown. The spikes in the upper actogram represent the activity counts per epoch. The higher spikes indicate higher activity. The lower actogram is an expanded window from the upper actogram in the nighttime. The solid bars in the lower actogram represent bouts considered as wake, according to the algorithm. Bedtime and get up time were manually entered. The other sleep parameters were automatically calculated.

