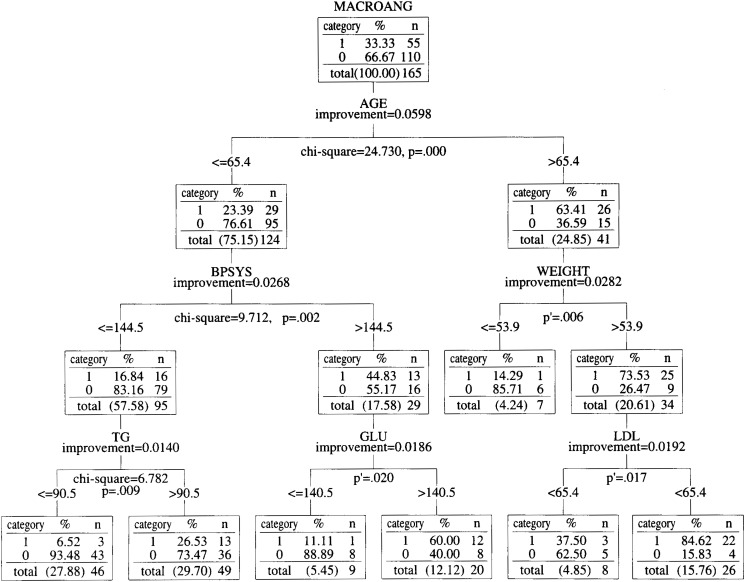
Figure 1. Classification tree of diabetes patients by macroangiopathy risk factors.
The root node of Figure 1 indicates that there were 165 total observations, and 55 of the 165 patients have had an episode of macroangiopathy, (i.e., patients belonging to category 1 had a previous episode, and patients belonging to category 0 had not had an episode.) Each node below the root node has the same meaning: the column in the node labeled “category” tells us which category is described in a row, the column labeled “%” tells us what percentage of the subjects in that node fall into that category, and the column labeled “n” tells us how many patients are in that category. At each branch point, “improvement” shows the value of the Gini standard function (see Appendix) at the point, “p” stands for the p value of the chi-square test and “p′ (p prime)” stands for the p value of Fisher’s exact test. All differences are significant at p<0.02. MACROANG, BPSYS, TG, GLU, LDL and FFA in Figure 1 stand for macroangiopathy, systolic blood pressure, triglyceride, fast blood sugar, low density lipoprotein and free fatty acid, respectively.

