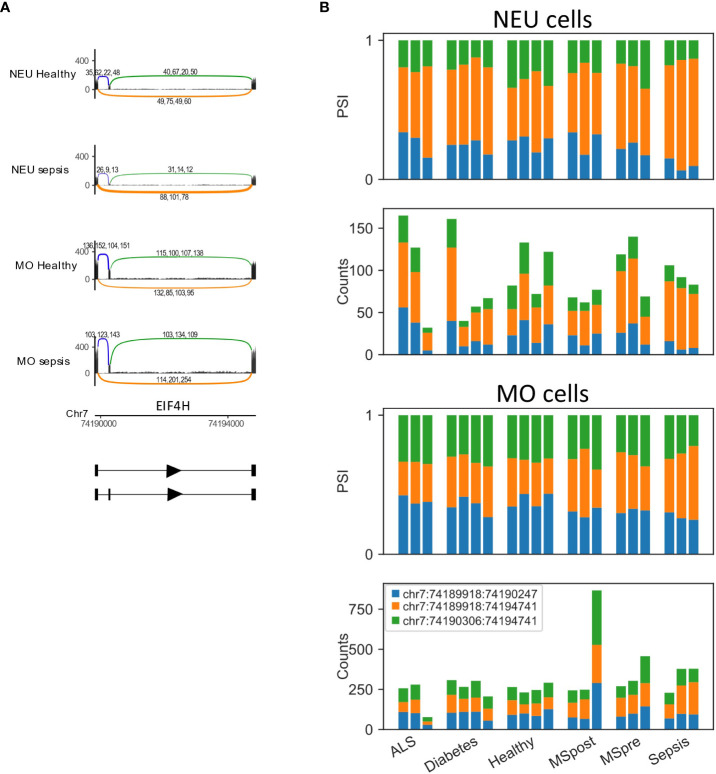
Figure 7.
EIF4H is differentially spliced in sepsis. (A) Skipped exon in EIF4H. The Sashimi plots of neutrophils (NEU; healthy and sepsis, top) and monocytes (MO; healthy and sepsis, bottom) display the number of mapped reads; the splice junctions are shown as arcs. Samples from healthy or sepsis are overlaid on one another. The numbers on each arc are the junction spanning read (JSR) counts of each sample. The order of the samples is the same for all junctions. (B) Bar plots of EIF4H skipped exon differentially spliced LeafCutter cluster (DS-LC) from neutrophils (NEU; fraction and counts of JSR in all samples, top) and monocytes (MO; fraction and counts of JSR in all samples, bottom) from all samples. The JSRs of each junction are colored in the colors of the arcs of that junction in (A).

