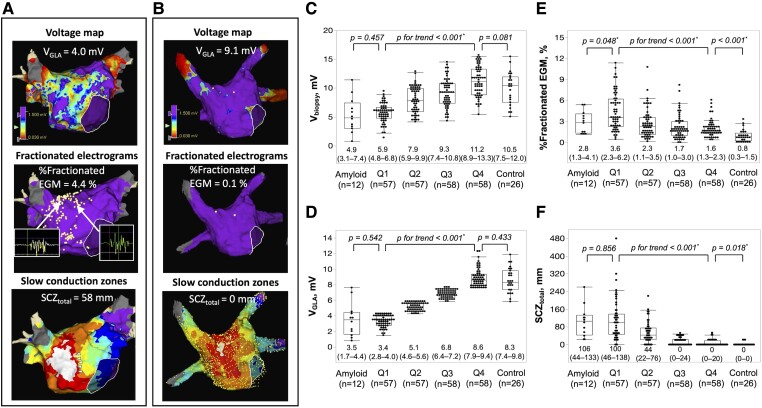
Figure 4.
Examples of electroanatomic maps of a patient with persistent atrial fibrillation with reduced VGLA, high %fractionated EGM, and long SCZtotal (A) and a patient in the control group with preserved VGLA, very low %fractionated EGM, and no SCZ (B). White dots in the middle panels show the sites with fractionated electrograms. Examples of fractionated electrograms are shown. White arrow heads indicate local slow conduction zones at the anterior wall. The relationship between the quartile category of VGLA and Vbiopsy (C), VGLA (D), %Fractionated EGM (E), and SCZtotal (F). Comparisons between Q1 category vs. the amyloid group and Q4 category vs. the control group are also shown. * P < .05; LA, left atrium; SCZ, slow conduction zones; SCZtotal, total width of slow conduction zones; Vbiopsy, voltage at the biopsy site; VGLA, global LA voltage; %Fractionated EGM, proportion of fractionated electrograms.

