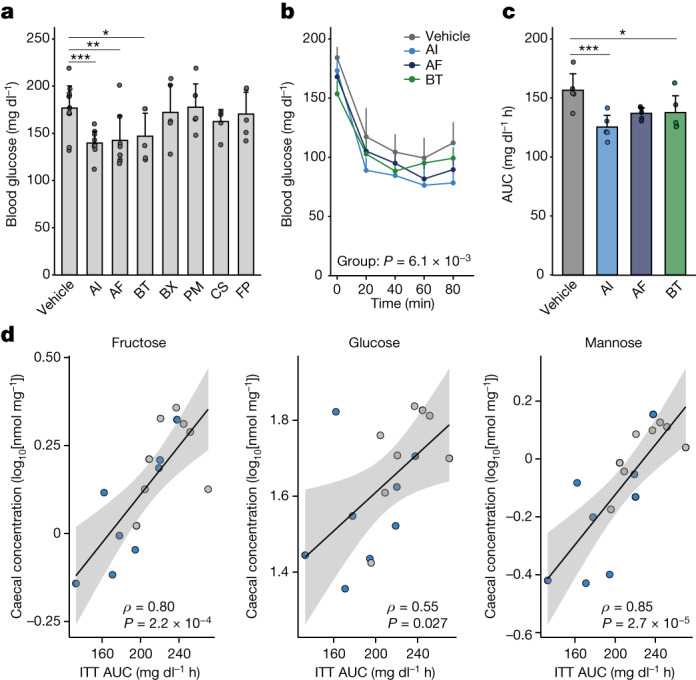
Fig. 4. IS-associated bacteria ameliorate IR in experimental models.

a, Postprandial blood glucose in mice fed a high-fat diet at 4 weeks after the initiation of bacterial administration. The abbreviations are defined in Extended Data Fig. 8a. n = 12 (vehicle), n = 10 (A. indistinctus and A. finegoldii) and n = 5 (other groups) mice. b,c, Blood glucose levels during the insulin tolerance test (b) and the AUC (c) (n = 5 per group). d, The correlations between the AUC of the insulin tolerance test and caecal levels of fructose, glucose and mannose in the A. indistinctus (sky blue) or vehicle (grey) groups. Spearman’s coefficients (ρ) and P values are shown. The lines and grey zones show the fitted linear regression lines with 95% confidence intervals. ITT, insulin tolerance test. Representative data of two (a and d) or three (b and c) independent experiments. For a–c, data are mean ± s.d. Statistical analysis was performed using Kruskal–Wallis tests with Dunn’s test (a and c) and two-way repeated-measures analysis of variance (ANOVA) (b). *P < 0.05, **P < 0.01, ***P < 0.001 (a and c). Exact P values for a and c are provided in the Source Data.
