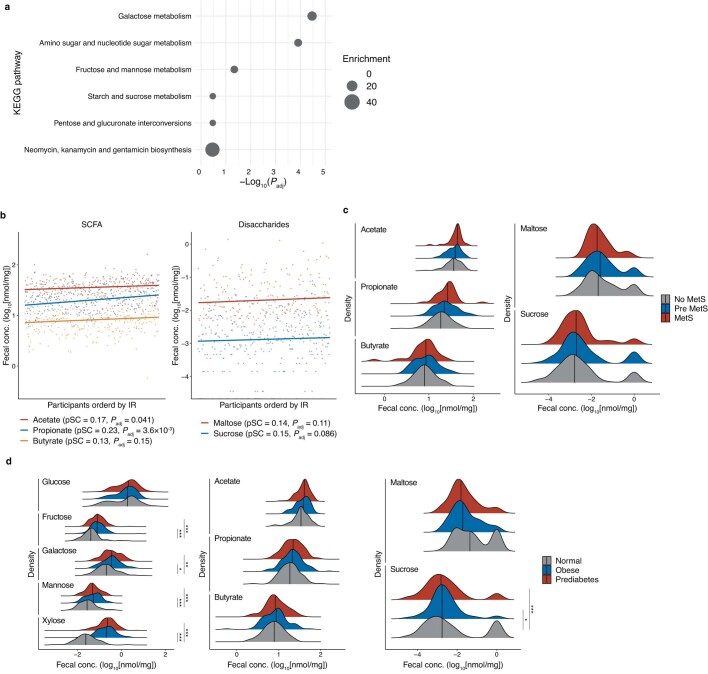
Extended Data Fig. 2. Faecal carbohydrate metabolites are increased in IR and MetS.
a, The KEGG pathway enrichment analysis of the metabolites in hydrophilic CAGs 5, 8, 12, 15, and 18, which were associated with IR in Fig. 1b. The size of disks shows the enrichment (i.e., the ratio of observed numbers and expected numbers of metabolites in each KEGG pathway). The pathways with raw P values < 0.05 are shown in the figure. b, Partial correlations between HOMA-IR and faecal levels of short-chain fatty acids (SCFA) such as acetate, propionate, and butyrate (left panel), and disaccharides such as maltose and sucrose (right panel). The coefficients (pSC) and P values of partial Spearman’s correlations adjusted by age and sex are described (n = 282). c, Faecal levels of SCFA (left panel) and disaccharides (right panel) were compared between no MetS, pre MetS, and MetS (n = 306). d, Faecal levels of monosaccharides (left panel), SCFA (middle panel), and disaccharides (right panel) were compared between healthy, obese, and prediabetes (n = 306). Density plots indicate median and distribution. *Padj < 0.05, **Padj < 0.01, ***Padj < 0.001; hypergeometric test with multiple test corrections (a) and rank-based linear regression adjusted by age and sex (c, d). The detailed statistics are reported in Supplementary Table 5, 6.

