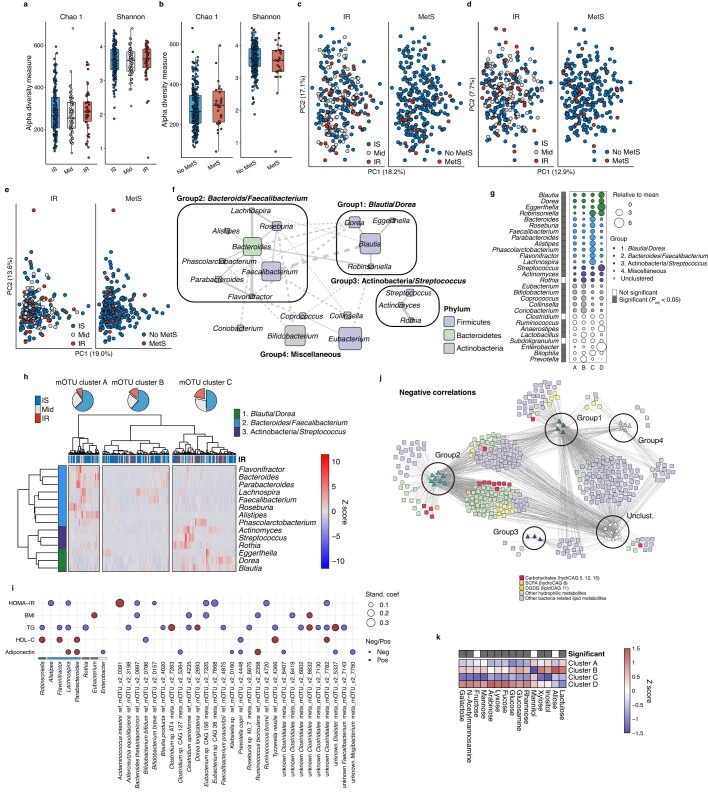
Extended Data Fig. 5. Faecal microbiota in IR.
a, b, Chao1 and Shannon’s alpha diversity indices in IR and MetS (n = 282). c, d, PCoA plots of Bray-Curtis dissimilarity, showing the variations of faecal microbiota at the genus level based on 16S rRNA gene sequencing (c), and at the species (mOTU) level based on shotgun sequencing (d), clustered by IR or MetS (n= 282). Dots represent individual data summarized into PCo1 and PCo2. e, PCA plots showing the variations of KEGG orthologues based on shotgun metagenomic sequencing clustered by IR or MetS (n = 266). Dots represent individual data summarized into PC1 and PC2. f, Co-abundance groups of genus-level microbes and their abundance in the participant clusters defined in Fig. 2a. Co-abundance was determined based on compositionality-corrected Spearman’s correlations, with Padj < 0.05 considered significant. The disk size represents the median abundance in the participants. Three co-abundance groups were determined based on their networks, while the rest of the microbes were named as “miscellaneous”. g, The co-abundance groups of genus-level microbes and their abundance in the participant clusters. Those not clustered by compositionality-corrected Spearman’s correlations in f were shown as “Unclustered”. The size of the disks represents overabundance to the mean in four clusters of participants determined in Fig. 2a. The far-left column shows the genera that exhibit significant differences among the four clusters. h, The co-abundance clusters of microbes at the genus level using the shotgun metagenomic data and their abundance (n = 266). The genera forming distinct groups in f, i.e., groups 1, 2, and 3, were included in this analysis. The participants were clustered into three mOTU clusters A to C based on the heatmap clustering. The proportion of individuals with IS, intermediate, and IR are shown in the pie charts above the heatmap as Fig. 2a. i, The associations between representative metabolic markers and genera (left panel, n = 282) and mOTU (right, n = 266). Only those with significant associations with metabolic markers are depicted. The disk size and colour represent absolute values of standardized coefficient and the direction of associations. The detailed statistics are reported in Supplementary Table 11. j, Microbe-metabolite networks of IR- or and IS-associated co-abundance microbial groups from Fig. 2a and faecal metabolites (n = 282). All faecal hydrophilic metabolites and faecal microbe-related lipid metabolites were included in the analysis. Only those with negative Spearman’s correlation between the genus-level microbial abundance and the metabolites with Padj < 0.05 are shown, which is complementary to Fig. 2c. The metabolites in CAGs relating to carbohydrates shown in Fig. 1b are highlighted in red. k, The relative abundance of IR-associated faecal carbohydrates in the participant clusters. The metabolites significantly different among these four clusters are coloured grey in the top row. a, b, Box plots indicate the median, upper and lower quartiles, and upper and lower extremes except for outliers. Kruskal-Wallis test (g, k). See the Source Data (g) for exact P values.

