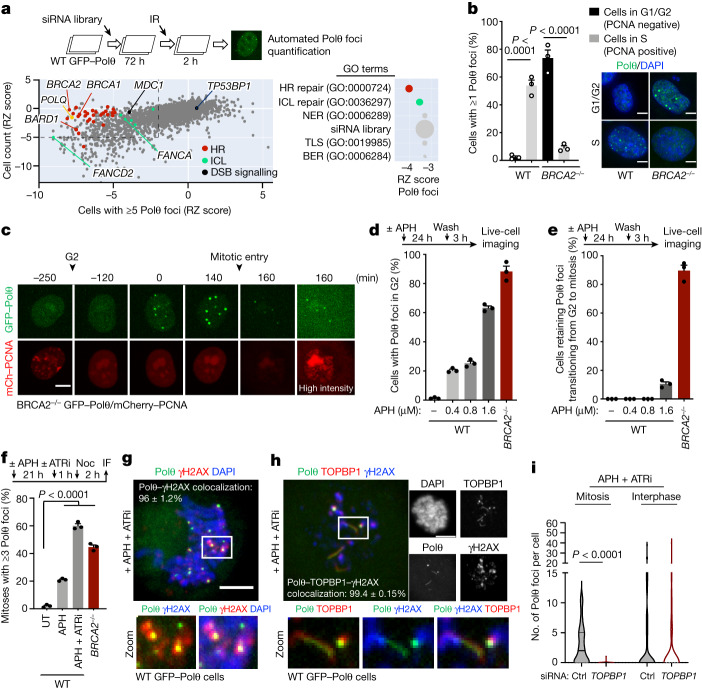
Fig. 1. Polθ is differentially recruited to DSBs depending on HR status and cell cycle phase.
a, Top, schematic of siRNA screen for ionizing radiation (IR)-induced Polθ foci formation. Bottom, robust Z-score (RZ score) for cell survival and Polθ foci formation for siRNA against indicated targets. For each siRNA, the median RZ score of three replicate experiments is shown. Arrows show the strongest RZ score for the indicated gene. Right, enriched Gene Ontology (GO) terms for biological processes identified among all targets. BER, base excision repair; ICL, interstrand crosslink repair; NER, nucleotide excision repair; TLS, translesion synthesis. b, Cell cycle distribution of Polθ foci in wild-type (WT) and BRCA2−/− cells (left), as determined by confocal microscopy (right). WT G1/G2: n = 407; WT S: n = 137; BRCA2−/− G1/G2: 119; BRCA2−/− S: n = 187. c, Representative images from live microscopy analysis of BRCA2−/− cells expressing GFP–Polθ and mCherry (mCh)–PCNA. d, Quantification of Polθ foci in G2 in wild-type and BRCA2−/− cells with indicated doses of aphidicolin (APH). Top, schematic of the experiment. e, Quantification of cells retaining Polθ foci while transitioning from G2 to mitosis. d,e, At least 30 cells were analysed for each condition per experiment. f, Quantification of Polθ foci in mitotic cells upon indicated treatment (aphidicolin: 0.4 μM, 24 h). Untreated (UT): n = 165; aphidicolin: n = 87; aphidicolin + ATR inhibitor VE-821 (ATRi): n = 152; BRCA2−/−: n = 165. IF, immunofluorescence; Noc, nocodazole. g,h, Representative images and quantification of colocalization of Polθ foci (g) and filaments (h) with γH2AX and TOPBP1 in mitosis. i, Quantification of Polθ foci formation upon indicated treatment in interphase or mitotic cells. All scale bars represent 5 μm. Mitosis control (Ctrl): n = 58; mitosis TOPBP1: n = 38; interphase control: n = 53; interphase TOPBP1: n = 83. Data represent three biological replicates. Data are mean ± s.e.m, except in violin plots (i), which show median with quartiles. b,f, Chi-square test. b, Wild type, χ2 = 43.6427; BRCA2−/−, χ2 = 130.003. f, aphidicolin + ATRi, χ2 = 129.9292; BRCA2−/−, χ2 = 85.7293. i, Kruskal–Wallis test corrected with Dunn’s multiple comparisons test.

