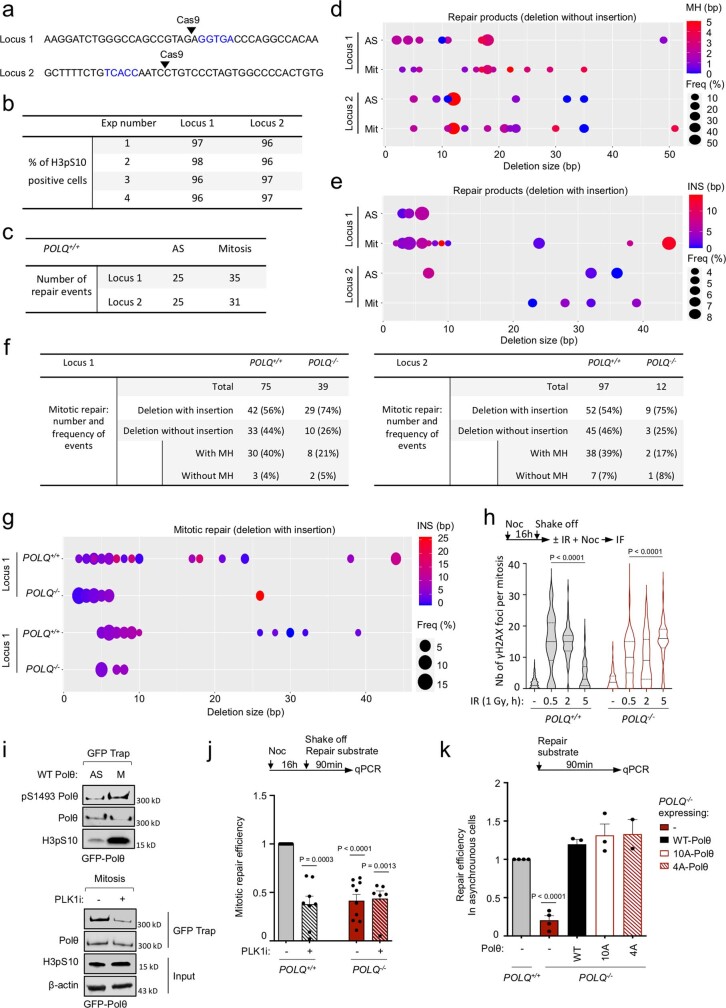
Extended Data Fig. 7. related to Fig. 3. Polθ repair signature in asynchronous and mitotic cells.
a, DNA sequences of CRISPR-Cas9 induced-cleavage sites at locus 1 and locus 2. Blue letters indicate Hph1 recognition site. b, Quantification of H3pS10 positive cells (mitotic), assessed by immunofluorescence, in indicated experiments. c, Total number of DNA repair events obtained at both loci from asynchronous (AS) and mitotic cells. d,e, Graph showing the frequency, deletion size and MH use of DNA repair events identified in asynchronous (AS) and mitotic (Mit) cells. f, Table recording number and frequency of repair events (with or without insertion). g, Graph showing the frequency, deletion and insertion size of mitotic DNA repair events identified in WT and POLQ−/− cells. h, Quantification of γH2AX signal at different time points after radiation (1 Gy) in mitosis. From left to right, n = 119, 60, 91, 104, 81, 203, 91, 116. i, Immunoblot analyses following immunoprecipitation of indicated constructs. j,k, DNA repair efficiency upon indicated treatment and in mitotic (j) or asynchronous (k) indicated cell lines. From left to right, for (j), n = 10, 8, 10, 6; for (k), n = 4, 4, 3, 3, 2. Data represent three biological replicates, except where indicated. Data shows mean +/− S.E.M., expect violin plots (i) showing median with quartiles. For (h) Kruskal-Wallis test, corrected with Dunn’s multiple comparisons test; for (j,k) mixed-effects analysis was performed, corrected with Holm-Šídák’s multiple comparisons test.

