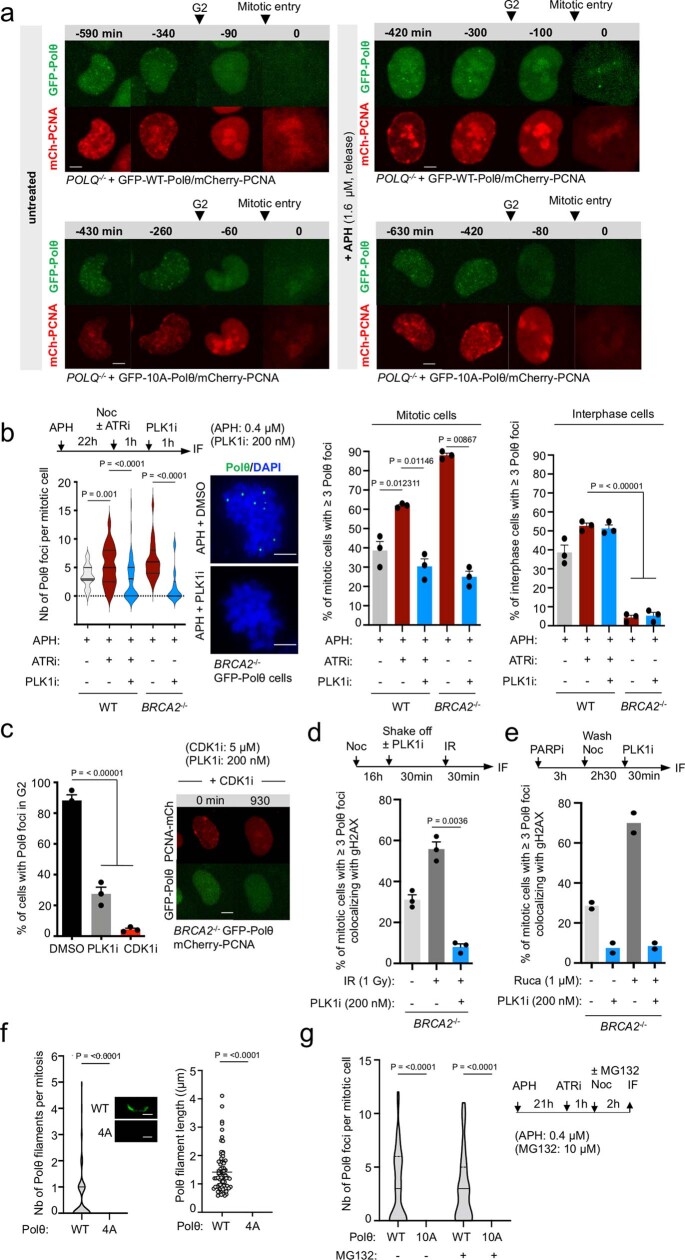
Extended Data Fig. 8. related to Fig. 3. Polθ foci formation in mitosis are dependent on its phosphorylation by PLK1.
a, Representative images of live microscopy analysis of POLQ−/− cells expressing WT- or 10A- Polθ and mCherry-PCNA. b,c,d,e, Representative images and quantification of Polθ foci formation following indicated treatment in indicated phases of the cell cycle in WT and BRCA2−/− cells. In (b), from left to right, n = 46, 57, 57, 146, 40, 77, 95, 52, 150, 48, 203, 199, 156, 325, 152. In (c, d), n > 30 for each condition in each replicate. In (e), from left to right n = 52, 54, 63, 76; among two replicates. f, Quantification of number and length of Polθ filaments in cells expressing WT- or 4A-Polθ. From left to right, n = 87, 114, 77, 0. g, Quantification of Polθ foci formation following indicated treatment in cells expressing WT- or 10A-Polθ. Data represents two biological replicates. From left to right, n = 45, 24, 39, 37. Scale bars represent 5 μm. Data represents three biological replicates, except where indicated. Data shows mean +/− S.E.M., except violin plots (b,f,g) showing median with quartiles. For (b1 (left), g) Kruskal-Wallis test, corrected with Dunn’s multiple comparisons test; for b2-3, chi-square test, with chi-square statistics, from left to right: 6.2656, 10.5753, 6.8895, 95.0355, 45.1237; for (c) Mixed-effects analysis, corrected with Holm-Šídák’s multiple comparisons test; for (d) unpaired t-test; for (f) two-tailed Mann-Whitney test was performed.

