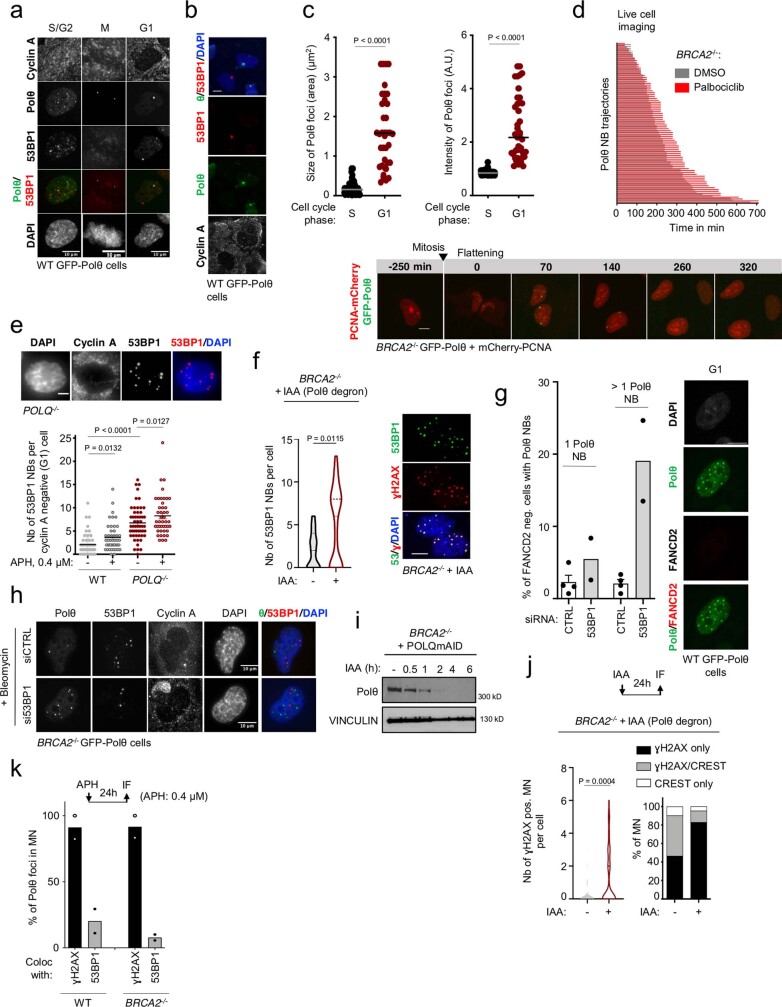
Extended Data Fig. 9. related to Fig. 4. Polθ forms nuclear bodies (NBs) in G1.
a, b, Representative images of Polθ nuclear bodies (Polθ NBs) and 53BP1 nuclear bodies (53BP1 NBs) in cyclin A-negative (G1) cells. c, Size and intensity of Polθ foci in indicated cell cycle phases. From left to right, n = 98, 15, 86, 41. d, Trajectories of individual Polθ NBs in BRCA2−/− RPE-1 cells blocked in G1 (Palbociclib treatment). Representative images of Polθ NBs from formation at mitotic exit (flattening) to dissolution in G1 (PCNA-negative cells) in BRCA2−/− cells. e, Representative images and quantification of 53BP1 NBs in WT and POLQ−/− cells upon indicated treatment. From left to right, n = 45, 46, 53, 47. f, Representative images and quantification of 53BP1 NBs in BRCA2−/− cells following Polθ depletion (IAA treatment). From left to right, n = 43, 29. g, h, Representative images and quantification of Polθ NBs in FANCD2-negative (G1) cells upon indicated treatment. i, Immunoblot analysis at indicated time points upon Polθ degradation (IAA treatment). In (g), from left to right, n = 561, 448 (4, 2 replicates). j, Quantification of micronuclei (MN) positive for γH2AX and/or CREST (centromere marker) in BRCA2−/− cells following Polθ degradation (IAA treatment). From left to right, n = 75, 57; among two replicates. k, Quantification of Polθ foci in micronuclei (MN) in indicated cell lines. Scale bars represent 5 μm, except where indicated. Data represents three biological replicates, except where indicated. Data shows mean +/− S.E.M., except box plots (c) showing median with quartiles. For (c,f,j) two-tailed Mann-Whitney test; for (e) unpaired t-test was performed.

