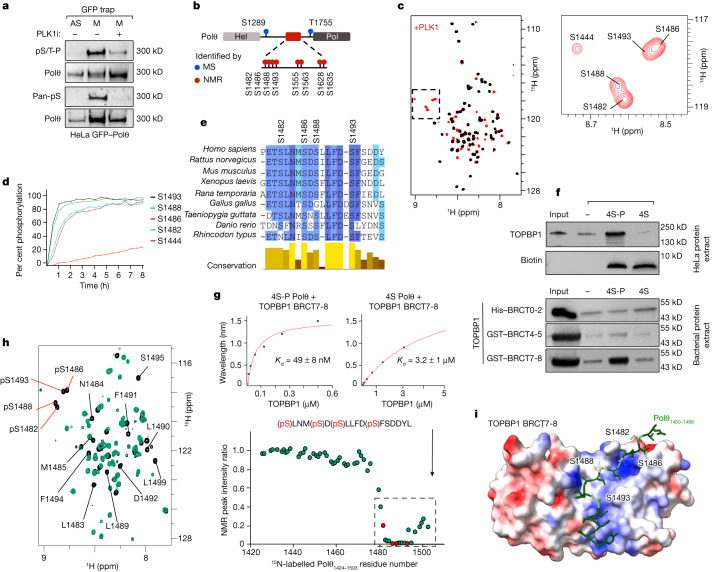
Fig. 2. Polθ is phosphorylated by PLK1 and binds to TOPBP1 in mitosis.
a, Immunoblot analysis with anti-Polθ, anti-phospho-Ser/Thr-Pro (pS/T-P) and pan-phosphoserine antibody following immunoprecipitation of Polθ–GFP from asynchronous (AS) and mitotic (M) cells. A representative experiment is shown; the experiment was repeated four times with similar results. b, Scheme depicting PLK1 phosphorylation sites on Polθ. MS, mass spectrometry. c, Left, superposition of the 2D NMR 1H-15N selective optimized flip angle short transient heteronuclear single quantum coherence (SOFAST HMQC) spectra recorded on an 15N,13C-labelled Polθ E1424–Q1503 fragment before (black) and after (red) incubation with PLK1. Right, magnified view of the spectral region containing NMR signals of phosphorylated residues. d, Phosphorylation kinetics, as monitored by real-time NMR. Intensities of NMR peaks corresponding to phosphorylated residues shown in c were measured on a series of SOFAST HMQC spectra recorded on the Polθ E1424–Q1503 fragment incubated with PLK1 and plotted as a function of time. e, Alignment and conservation score of nine homologous sequences of Polθ from vertebrates. Colours reflect the conservation score. f, Immunoblot analysis following immunoprecipitation of phosphorylated (4S-P) and non-phosphorylated Polθ peptides incubated with HeLa cell protein extract (top), and indicated TOPBP1 BRCT domains purified from E. coli (bottom). A representative experiment is shown; the experiment was repeated twice with similar results. g, Binding kinetics of phosphorylated (4S-P) and non-phosphorylated (4S) Polθ peptide titrated with purified TOPBP1 BRCT7-8, as observed by BLI. Kd, dissociation constant. h, Left, superposition of the 2D NMR 1H-15N SOFAST HMQC spectra recorded on a 15N-labelled phosphorylated Polθ E1424–Q1503 fragment before (black) and after (green) incubation with TOPBP1 BRCT7-8. Phosphorylation sites are indicated by red lines. Right, plot of the intensity ratio of peaks corresponding to each residue (in the bound versus free peptide) as a function of Polθ residue number. The dashed line outlines NMR peaks that disappear owing to the interaction of Polθ with TOPBP1 BRCT7-8. Red dots indicate phosphorylated residues. i, Model of the Polθ–TOPBP1 interaction, calculated using AlphaFold-Multimer. The Polθ peptide is displayed as green sticks, with phosphorylated serines in pale green. The TOPBP1 BRCT7-8 domain is displayed as a surface coloured as a function of its electrostatic potential (red, negatively charged; blue, positively charged).

