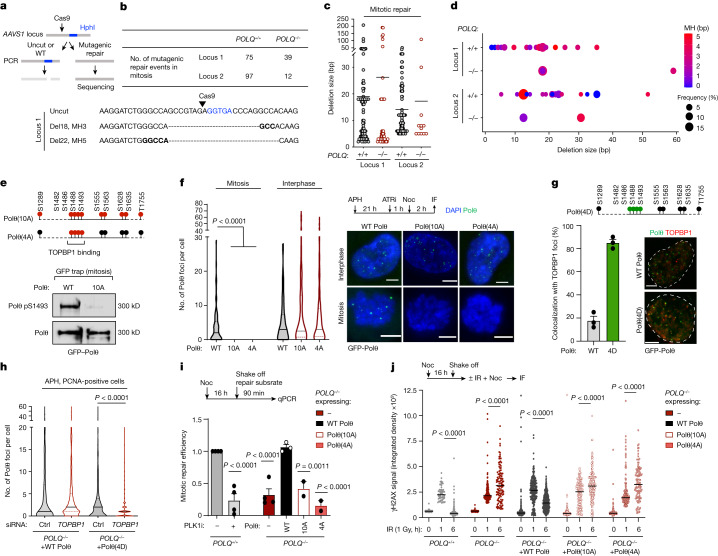
Fig. 3. Polθ phosphorylation and interaction with TOPBP1 enable DSB repair in mitosis.
a, Experimental workflow. b, Top, the number of mitotic DNA repair events identified following CRISPR–Cas9-induced cleavage in indicated cell lines. Bottom, representative repaired DNA sequences. Deletions (Del) and microhomology (MH) sizes are indicated. At repair junctions, microhomologies are indicated in bold and the Hph1 recognition site is in blue. c, Deletion size of mitotic DNA repair events identified in wild-type and POLQ−/− cells. Each dot represents a mitotic DNA repair event. d, The frequency, deletion size and use of microhomology in mitotic DNA repair events identified in wild-type and POLQ−/− cells. Events with deletions size greater than 60 bp are represented. e, Top, schematic representation of phosphorylation sites mutated in Polθ(10A) and Polθ(4A) constructs. Bottom, immunoblot analysis following immunoprecipitation of indicated construct. f, Representative images and quantification of Polθ foci and filaments in cells expressing wild-type Polθ, Polθ(10A) and Polθ(4A). Left to right: n = 98, 60, 37, 74, 219 and 50. g, Top, schematic representation of phosphorylation sites mutated in Polθ(4D). Bottom, representative images (right) and quantification (left) of Polθ foci colocalizing with TOPBP1 in cells expressing wild-type Polθ and Polθ(4D). Wild-type Polθ: n = 180; Polθ(4D): n = 150. h, Quantification of Polθ foci formation in cells expressing wild-type Polθ and Polθ(4D) upon indicated treatment in S phase cells. WT Polθ control: n = 620; WT Polθ TOPBP1: n = 582; Polθ(4D) control: n = 441; Polθ(4D) TOPBP1: n = 880. i, Mitotic repair efficiency in indicated cell lines upon indicated treatment. Left to right: n = 4, 4, 4, 3, 2 and 2. j, Quantification of γH2AX signal at different time points after ionizing radiation (1 Gy) in mitosis. Left to right: n = 119, 59, 152, 81, 203, 188, 388, 227, 532, 181, 155, 239, 216, 159 and 102, with two replicates. Mixed-effects analysis, corrected with Holm–Šídák’s multiple comparisons test. Scale bars, 5 μm. Data represent three biological replicates, except where indicated. Data are mean ± s.e.m., except in violin plots (e), which show median with quartiles. f,h,j, Kruskal–Wallis test, corrected with Dunn’s multiple comparisons test.

