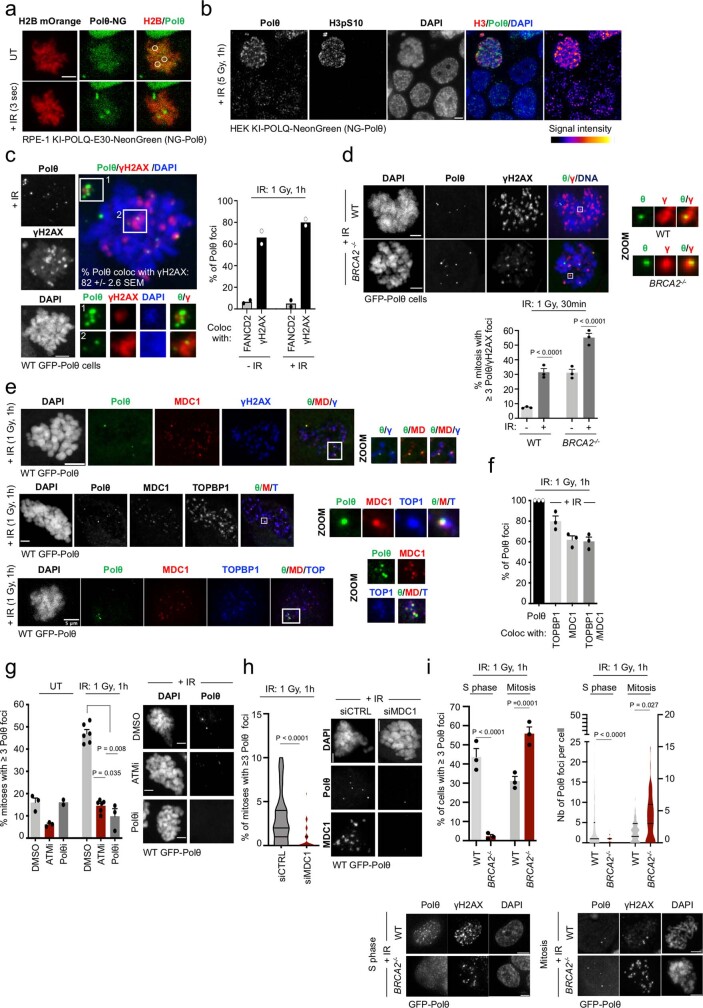
Extended Data Fig. 3. related to Fig. 1. Polθ forms radiation (IR)-induced foci in mitosis.
a,b, Representative images of endogenous NG-Polθ foci formation upon (a) laser microirradiation or (b) X-ray irradiation (5 Gy, 1 h) in HEK cells. H3pS10 stains mitotic chromatin. c,d,e,f,g, Representative images and quantification of Polθ foci formation and colocalization with indicated proteins in mitosis following indicated doses of (X-ray) irradiation. In (d), from left to right, n = 88, 90, 76, 81; in (c,f), at least 35; in (g) at least 20 cells were analyzed in each condition in each replicate (two for (f)). h, Quantification of irradiation-induced Polθ foci following transfection with indicated siRNAs. From left to right, n = 57, 38, among two replicates. i, Representative images and quantification of irradiation-induced Polθ foci in WT and BRCA2−/− cells in indicated cell cycle phases. From left to right, n = 974, 276, 75, 73. Scale bars represent 5 μm. Data represents three biological replicates, except where indicated. Data shows mean +/− S.E.M. For. For (d, i-2 (right)) chi-square test was performed, with chi-square statistics from left to right, in (d): 20.6912, 21.258; in (i-2): 160.6157, 9.7992; for (h) two-tailed Mann-Whitney test; for (g, i-1 (left)) Kruskal-Wallis test, corrected with Dunn’s multiple comparisons test was performed.

