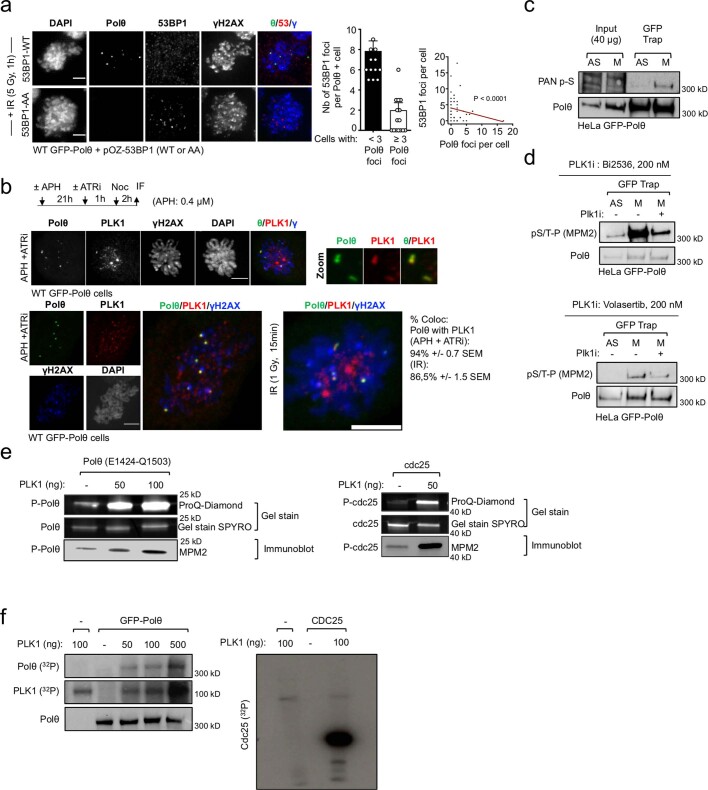
Extended Data Fig. 4. related to Fig. 2. Polθ is phosphorylated by PLK1 in mitosis.
a, Representative images and quantification of GFP-Polθ foci formation in cells expressing wild-type (WT) or mutant (AA) 53BP1 upon irradiation in mitosis. 30 cells were analyzed among 3 replicates. Data shows mean +/− S.E.M. Fisher’s exact test was performed to determine significance. b, Representative images and quantification of Polθ foci colocalization with PLK1 in mitosis following indicated treatment. Experiments were repeated twice with similar results. c,d, Immunoblot analysis following immunoprecipitation of GFP-tagged Polθ in asynchronous or mitotic cells upon indicated treatment. Representative experiments are shown; experiments were repeated three times with similar results. e, Representative in vitro phosphorylation assay with the Polθ fragment (E1424 to Q1503) incubated with recombinant PLK1 enzyme. Phosphorylation signals were revealed using Gel Stain and immunoblot analyses (MPM2 antibody). Cdc25 phosphorylation by PLK1 is used as a control. Representative experiments are shown; experiments were repeated twice with similar results. f, Representative in vitro kinase assay with Polθ incubated with recombinant PLK1 enzyme and 32P-labeled ATP. Representative experiment is shown; experiment was repeated three times with similar results.

