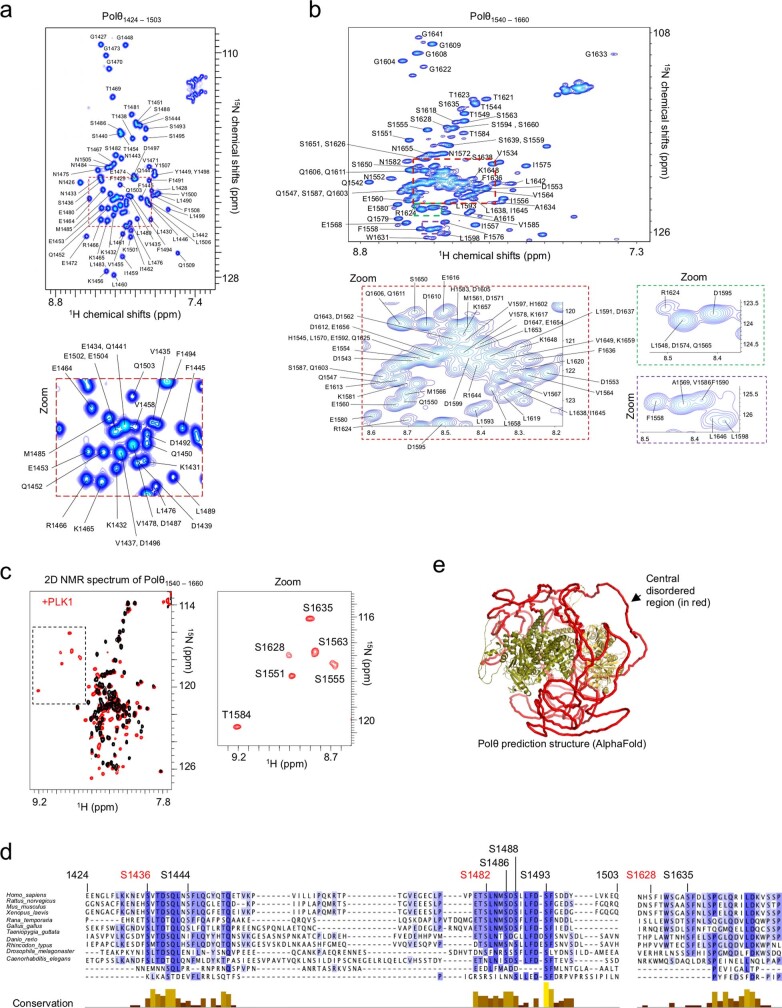
Extended Data Fig. 5. related to Fig. 2. Biochemical characterization of Polθ phosphorylation by PLK1.
a,b, Assignment of the 2D NMR 1H-15N SO-FAST HMQC peaks of the indicated Polθ fragments (E1424-Q1503 for a) (E1540-S1660 for b). c, Superposition of the 2D NMR 1H-15N SO-FAST HMQC spectra recorded on an 15N, 13C labeled Polθ fragment from E1540 to S1660, before (black) and after (red) incubation with PLK1. A zoom shows the spectral region containing the NMR signals of phosphorylated residues. d, Alignment of 11 homologous sequences of the Polθ fragment E1424-Q1503 and N1626-P1652. All labeled residues were detected as phosphorylated by PLK1. Residues marked in red correspond to canonical PLK1 phosphorylation sites. The conservation score was calculated using Jalview. e, AlphaFold model of the human Polθ protein. The two folded N-terminal and C-terminal domains are colored in green and yellow, respectively, while the disordered central region, from G895 to S1824, is colored in red.

