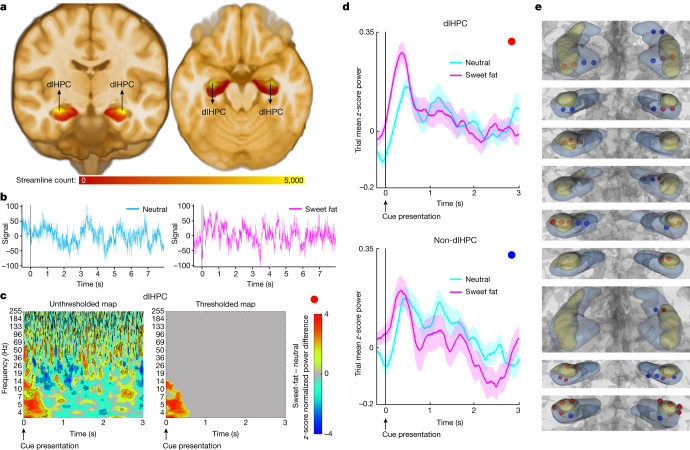
Fig. 1. dlHPC subregion involvement in food-related appetitive processing.
a, Tractography analysis of high-resolution, normative data from 178 participants from the HCP showing that tractography-defined LH–hippocampal area interconnections (that is, streamlines) converge in the dlHPC (yellow). b, Example traces of electrophysiological time-domain recordings from the dlHPC in one individual during a taste-neutral (left, cyan) and a sweet-fat (right, magenta) trial. The time interval displayed includes the pre-cue period (−0.5 to 0 s), cue presentation (0–1 s), fixation cross (1–3 s), solution delivery (3–5 s), fixation cross (5–6 s) and a portion of the remaining duration of solution receipt/consummatory phase (6–7.5 s). The detailed task paradigm is described in Supplementary Fig. 1. c, z-score-normalized difference spectrograms (sweet-fat minus taste-neutral solution) in the dlHPC. The colour bar indicates mean z-score power difference (using pooled channels as observations) between the two conditions compared with a null distribution. The outlined clusters (left) reflect significant contiguous time–frequency voxels (P < 0.05, two-sided paired nonparametric cluster-based permutation testing, 1,000 permutations, n = 34 channels) before correction for multiple comparisons. The thresholded map (right) displays significant time–frequency clusters after correction for multiple comparisons using cluster size (Methods). d, 4–6 Hz mean z-score power time traces during cue (0–1 s) and after cue anticipation (1–3 s) of sweet-fat (magenta) and taste-neutral (cyan) solutions in the dlHPC (top) and non-dlHPC (bottom) hippocampal sites. 0 s and 1 s reflect the cue and fixation cross image presentation times, respectively. e, Hippocampal coverage per participant (n = 9). The red contacts indicate the contacts in direct contact with the dlHPC (yellow subregion). 3D volumes were rendered using DSI Studio (v.2022; publicly available at https://dsi-studio.labsolver.org/).

