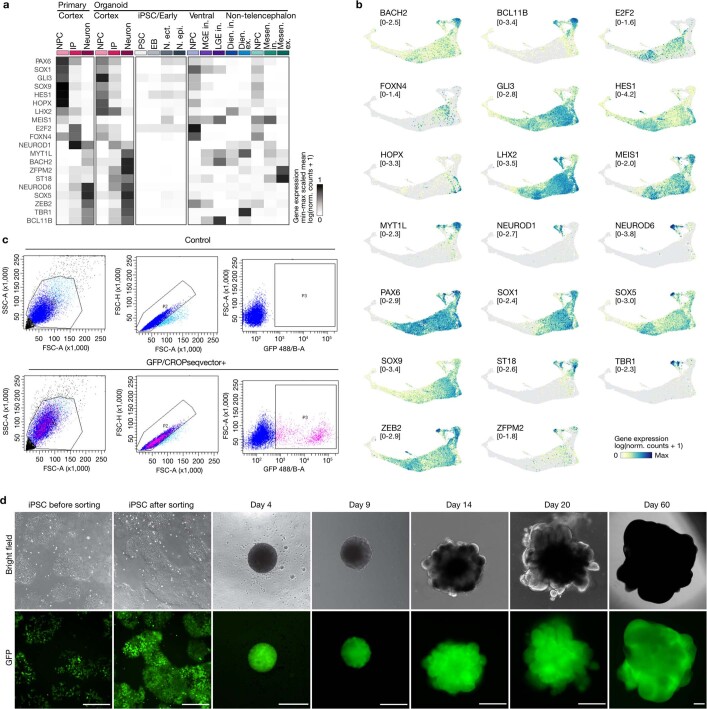
Extended Data Fig. 6. Target selection and experimental details for the single-cell in organoid perturbation experiment.
a, Min-max scaled mean expression (log(transcript counts per 10k + 1)) of genes targeted in the single-cell genomic perturbation experiment in neuronal progenitors (NP), intermediate progenitors (IP) and neurons in the primary human and organoid developing cortex, as well as in iPS cells, the embryoid body (EB), ventral telencephalic NPCs, inhibitory neurons of the medial ganglionic eminence (MGE in.), lateral ganglionic eminence (LGE in.), non-telencephalic NPCs, diencephalic excitatory neurons (Dien. ex.) and inhibitory neurons (Dien. in.) and mesencephalic excitatory neurons (Mesen. ex.) and inhibitory neurons (Mesen. in.). b, UMAP embedding coloured by the expression of all targeted genes. The range of expression values is indicated for each feature plot. c, Exemplary Fluorescence-activated cell sorting plots of the sorting scheme used to isolate CROP-seq vector positive iPS cells. d, Phase contrast and CROP-seq vector positive (GFP) imaging during brain organoid development. Images are representative for 48 imaged organoids. Scale Bar is 500 µm.

