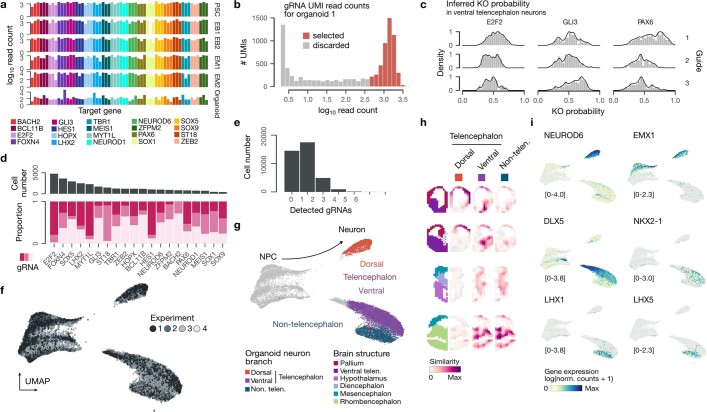
Extended Data Fig. 7. Guide detection and cell type annotation in the single-cell perturbation experiment in organoids.
a, Barplot showing number of cells with detected guide RNA (gRNA) for each targeted gene and stacked barplot showing the distribution of the different gRNAs targeting the same gene. b, Histogram showing the distribution of read counts for gRNA UMIs after amplicon sequencing for one organoid. UMIs marked in red were selected for downstream analyses. c, Density histograms showing the distribution of inferred KO probabilities for gRNAs of 3 different target genes. d, Barplot showing cell number and proportion of gRNAs for all target genes. e, Barplot showing the number of guides detected in sequenced cells. f, UMAP embedding with cells coloured based on experiment. g, UMAP embedding coloured by annotated neuron subtypes. h, VoxHunt plots showing expression similarity of neuron subtypes in brain organoids to voxels in five example sections of the developing mouse brain (embryonic day 13.5), as well as the structural annotation of the sections (left). i, UMAP embedding coloured by expression (log(transcript counts per 10k + 1)) of non-telencephalic (top), ventral (middle) and dorsal (bottom) neuron markers. The range of expression values is indicated for each feature plot.

