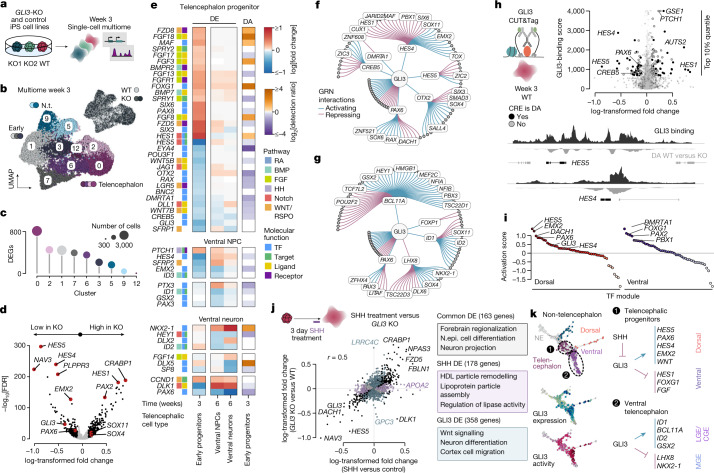
Fig. 4. Single-cell multiome view of GLI3 loss of function reveals distinct regulomes and effectors of dorsoventral telencephalon specification.
a, Schematic of the experiment measuring the transcriptome and chromatin accessibility in the same cell at 3 weeks of brain organoid development. b, UMAP embedding coloured by cluster and labelled by projected cell fate. Inset: UMAP coloured by genetic state. c, The number of DEGs of control (WT) versus GLI3-KO cells in the different clusters. d, Differential expression in telencephalic progenitors (clusters 0 and 2) after GLI3 KO. e, DEGs after GLI3 KO for early telencephalic progenitors (week 3), ventral telencephalic progenitors (week 6) and neurons (week 6), and differential accessibility after GLI3 KO in early telencephalic progenitors (week 3). Genes are coloured according to the associated signalling pathway (if applicable) and molecular function. f,g, GRN subgraph for early telencephalic (f) and ventral telencephalon (g) progenitors, showing first- and second-order GLI3 targets. The circles represent genes for which all TFs are labelled. The edges are coloured on the basis of TF regulatory interaction. h, The GLI3-binding score (the sum of CUT&Tag signal intensity for the gene body + 2 kb) in WT organoids versus log-transformed fold change in differential expression in early telencephalic progenitors (week 3). Genes with differentially accessible (DA) CREs are coloured black. Signal tracks of GLI3 binding matched with differential accessibility peaks of HES4 and HES5 in early telencephalic progenitors. i, The z-scored mean correlation between module gene expression and branch probabilities (branch activation score) for differentially expressed TFs. j, The log-transformed fold change of genes after treatment with SHH versus GLI3 KO. GO terms are shown for common DEGs, SHH-treatment-specific and GLI3-specific DEGs. k, Schematic summarizing the results from the GLI3 and SHH perturbations.

