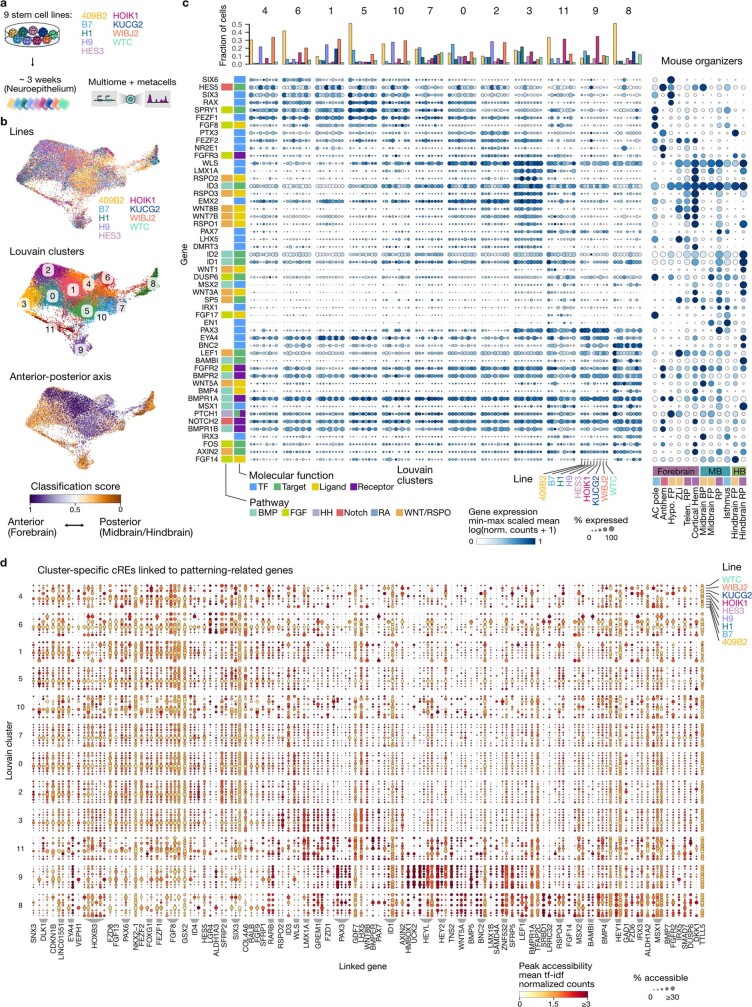
Extended Data Fig. 3. Signalling transcriptome and regulatory element landscape of the organoid neuroepithelium from 9 stem cell lines.
a, Schematic of the experimental setup. Multiome quantification was performed on organoids in the neuroepithelial stage (~3 weeks) from a total of 9 stem cell lines. The data was combined with the data from the same stage in the early time course. b, UMAP embedding coloured by cell line, louvain clusters and anterior-posterior axis (forebrain versus non-forebrain) classification score. c, Bar plots (top) showing fraction of cells per cell line in each cluster. Dotplot (left) showing min-max scaled expression (log(transcript counts per 10k + 1)) (colour) and proportion of expressing cells (dot size) for transcription factors (TFs) and genes from different signalling pathways in clusters of 3 week old organoid data set split by cell line. All genes are annotated as TF, receptor, ligand, or TF target and if applicable, coloured by the related signalling pathway. Dotplot (right) showing expression (colour) and proportion of expressing cells (dot size) for the same genes of Extended Data Fig. 3d in mouse developing brain organizer cells of different brain regions6. d, Dot plot showing cluster-specific cis regulatory elements (CREs) linked to patterning genes split by different cell lines. Colour and size indicate peak accessibility (if-idf normalized fragment counts) and proportion of expressing cells, respectively.

