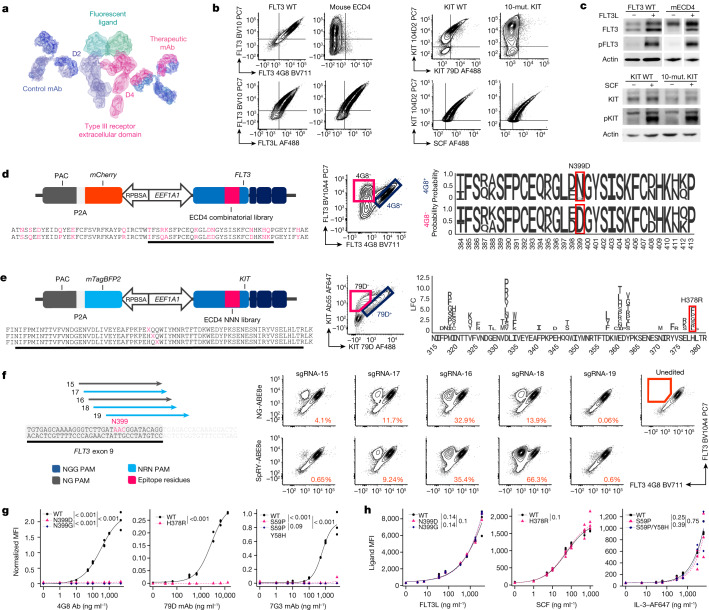
Fig. 1. Epitope engineering can be achieved by base editing.
a, Type III receptor tyrosine kinases bound to control and therapeutic antibodies. AlexaFluor 488 (AF488)- or AF647-conjugated ligands were used to assess binding affinity. Protein models are based on Protein Data Bank 3QS9 (FLT3) and 1IGT (Ig). mAb, monoclonal antibody. b, Loss of 4G8 and Fab-79D binding to FLT3 with 16 amino acid substitutions or KIT with 10 amino acid substitutions, respectively (top). Bottom, ligand assay for WT and mutated receptor variants. Mut., mutation. c, Western blot analysis of phosphorylated FLT3 at Tyr589–591 and KIT at Tyr719 on receptor variants. d, FLT3 combinatorial library. Left, the Sleeping Beauty plasmid expressing FLT3 with human or mouse codons at 16 positions (red) within ECD4. Middle, K562 cells were transduced with the FLT3 library. 4G8−and 4G8+ fractions were sorted using fluorescence-activated cell sorting (FACS) and sequenced by next-generation sequencing (NGS). Right, the relative amino acid frequency at positions 384–413. e, KIT epitope mapping. Left, the Sleeping Beauty plasmid containing degenerated codons (NNN) at each position (red) of ECD4. Middle, K562 cells were transduced with the KIT library. Fab-79D− and Fab-79D+ fractions were FACS-sorted and sequenced. Right, the log-transformed fold change in amino acid substitutions enriched in Fab-79D− cells (positions 314–381). f, gRNAs targeting FLT3 codon N399 (left). Dark blue, NGG-PAM; grey, NGN-PAM; light blue, NRN-PAM. The PAM is indicated by the arrowhead. Right, plots of K562 reporter cells electroporated with base-editor plasmids (NG-ABE8e or SpRY-ABE8e). The percentage of 4G8− cells is reported (gating is shown on the unedited sample). g, Affinity of therapeutic antibodies to receptor variants measured on K562 (for FLT3 (left) and CD123 (right)) or NIH-3T3 (for KIT (middle)) cells. Affinity curves fitted to the MFI of therapeutic monoclonal antibodies normalized to control monoclonal antibodies, after background subtraction. n = 3. Statistical analysis was performed using likelihood ratio tests. h, FLT3, SCF and IL-3 affinity. Cell lines expressing FLT3 (left), CD123 (right) and KIT (middle) receptor variants were incubated with fluorescent ligands and evaluated using flow cytometry. An affinity curve was fitted to the ligand’s MFI. Statistical analysis was performed using likelihood ratio tests. n = 3 (FLT3 and CD123) and n = 4 (KIT).

