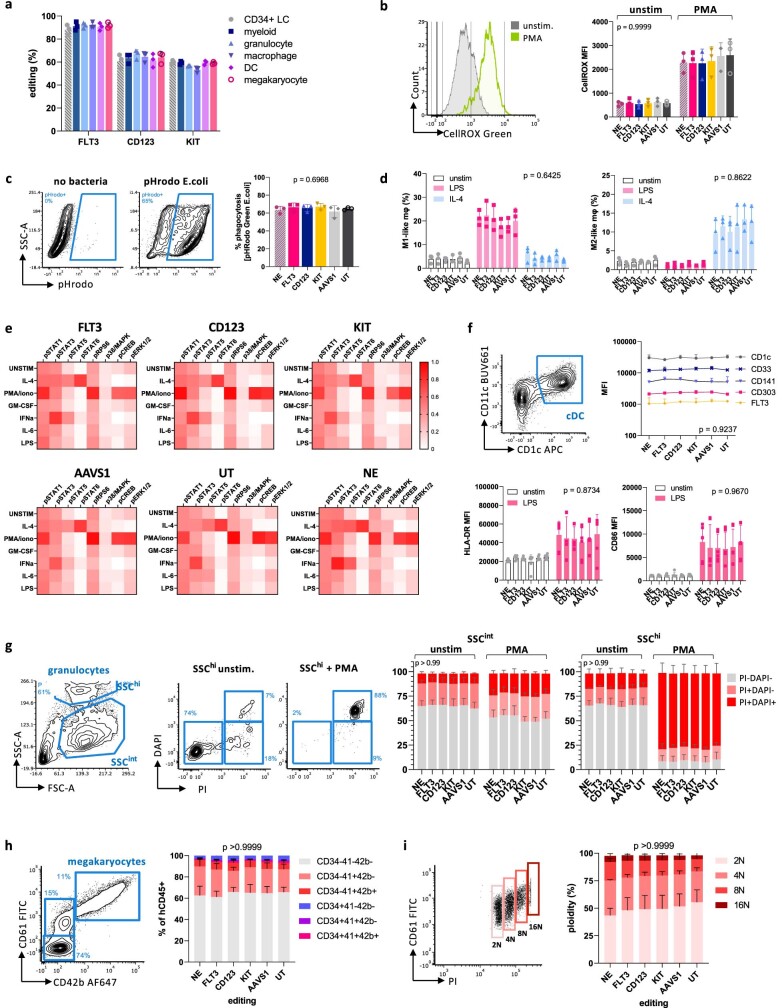
Extended Data Fig. 6. Hematopoietic cells derived from epitope-edited HSPCs show preserved function.
a. Editing efficiency of FLT3-, CD123- and KIT- edited CD34+ HSPCs differentiated in vitro toward myeloid, granulocyte, macrophage, dendritic cell and megakaryocyte lineages. N = 3 biological replicates. b. Reactive Oxygen Species (ROS) production of differentiated myeloid cells unstimulated or stimulated with PMA 5 ng/ul for 15 min at 37 °C, as measured by CellROX Green fluorescence. N = 3 biological replicates. Two-way ANOVA, the p-value of the editing effect is reported. c. Phagocytosis of E.coli loaded with pHrodo Green dye, which becomes fluorescent upon acidification of the phagolysosome. In vitro differentiated macrophages were incubated with E.coli for 60 min at 37 °C and then analysed by flow cytometry. Left, representative FACS plots. Right, % of phRodo+ macrophages. N = 3 biological replicates, technical duplicate. One-way ANOVA. d. Polarization of in vitro differentiated macrophages incubated with LPS or IL-4. Cells were stimulated with LPS 100 ng/mL or IL-4 20 ng/mL and then analysed by flow cytometry. The % of cells with and M1-like or M2-like phenotypes are reported in the bar plots. N = 3 biological replicates. Two-way ANOVA, the p-value of the editing effect is reported. e. Phospho-flow of in vitro differentiated myeloid cells stimulated with IL-4, PMA/ionomycin, GM-CSF, IFN type-I, IL-6 or LPS. MFI of each phosphorylated marker was scaled to the range between the FMO control and the highest measured value. The heatmaps show comparable phosphorylation patterns between editing conditions. f. In vitro differentiation of classical dendritic cells and expression of co-stimulatory surface markers upon LPS stimulation. Top left, representative FACS plot showing gating for CD1c+CD11c+ DCs. Top right, MFI of surface markers on gated cDC. Two-way ANOVA, the p-value of the editing effect is reported. Bottom, HLA-DR and CD86 MFI on cDC stimulated with LPS. N = 3 biological replicates. Two-way ANOVA, the p-value of the editing effect is reported. g. In vitro differentiation of granulocytes and NETosis induction by PMA stimulation. Left, representative FACS plots showing composition of differentiation culture with SSCint and SSChi populations (both are >80% CD33+66b+). Upon PMA stimulation and NETosis induction, the released nucleic acids are stained by DAPI and PI. Right, bar plots reporting the culture composition by DAPI+ and/or PI+ (%). N = 3 biological replicates, technical duplicates. Two-way ANOVA, the p-value of the editing effect is reported. h Differentiation of megakaryocytes from CD34+ HSPCs. Left, representative FACS plot showing surface expression of CD61 and CD42b. Right, culture composition of in vitro differentiated megakaryocytes. Bar plots report the % of CD34, C41, CD42b positive cells. N = 3 biological replicates. Two-way ANOVA, the p-value of the editing effect is reported. i DNA staining (PI) shows the generation of polyploid megakaryocytes up to 16N. Left, representative FACS plot showing the relationship between surface CD61 and DNA content. Right, culture composition of gated megakaryocytes by ploidy. Two-way ANOVA, the p-value of the editing (column) effect is reported.

