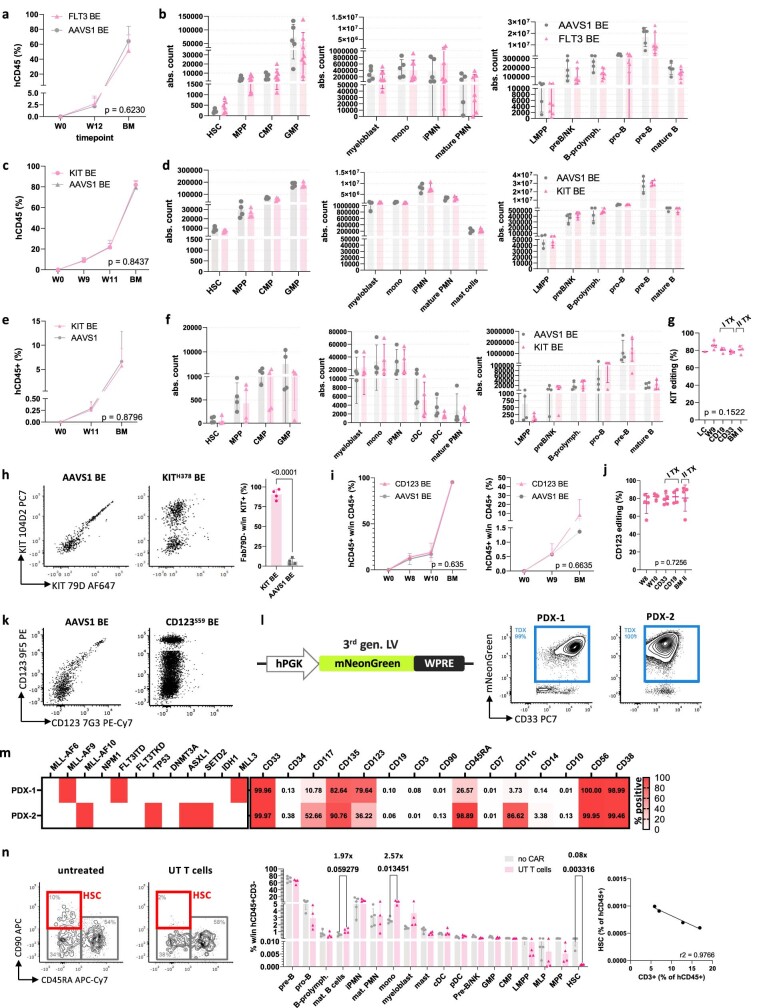
Extended Data Fig. 7. Epitope-edited HSPCs show preserved hematopoietic reconstitution and multilineage differentiation capacity.
a. Human engraftment by flow cytometry (% hCD45+) in the peripheral blood at 12 weeks (W12) and in the bone marrow at week 17 (BM) at endpoint of secondary recipient NBSGW mice xenotransplanted with BM cells from the experiment depicted in Fig. 3i. Each primary was transplanted in one secondary recipient. Mean ± SD. Comparison by 2-way ANOVA, the p-value of the editing effect is reported. b. Absolute counts of progenitor (left), myeloid (centre) and lymphoid (right) lineages in the BM of secondary xenotransplanted mice. AAVS1BE N = 4, FLT3N399 N = 7. Mean ± SD. HSC, hematopoietic stem cells; MPP, multipotent progenitors; LMPP, lymphoid-primed multipotent progenitors; CMP, common myeloid progenitors; GMP, granulo-mono progenitors; myeloblasts, defined as CD33/66b+19-14-11c-34-SSClow; mono, monocytes; iPMN, immature polymorphonucleate granulocytes; mature PMN, mature granulocytes. Multiple t-tests (only significant comparison are reported). c. Human engraftment by flow cytometry (% hCD45+) in the peripheral blood at 9, 11 weeks (W9, W11) and in the BM of NBSGW xenotransplanted with 1 M CD34+ HSPCs, either AAVS1BE or KITH378 edited. Mean ± SD. Comparison by two-way ANOVA, the p-value of the editing effect is reported. d. Absolute counts of progenitor (left), myeloid (centre) and lymphoid (right) lineages in the BM of mice from C. AAVS1 N = 4, KITH378 N = 4. Multiple t-tests (only significant comparison are reported). e. Human engraftment by flow cytometry (% hCD45+) in the peripheral blood at 11 weeks (W11) and in the bone marrow at week 14 (BM) of secondary recipient NBSGW mice xenotransplanted with BM cells from primary mice engrafted with KITH378 or AAVS1BE CD34+ HSPCs (experiment described in A). Each primary was transplanted in one secondary recipient. Comparison by two-way ANOVA, the p-value of the editing effect is reported. f Absolute counts of progenitor (left), myeloid (centre) and lymphoid (right) lineages in the BM of secondary xenotransplanted mice. AAVS1 N = 4, KITH378 N = 4. Multiple t-tests (only significant comparison are reported). g. KIT editing efficiencies measured on liquid culture (LC), total blood cells at week 9 after transplant (W9), on FACS-sorted B (CD19) and myeloid (CD33) BM cells at the end of the experiment, and on total BM from secondary recipients. Mean ± SD. One-way ANOVA. h. Left, representative FACS plots showing KIT staining with both therapeutic (Fab-79D) and control (104D2) mAb clones on BM hCD45+33+ cells from secondary xenotransplanted mice. Loss of Fab-79D staining in vivo is consistent with the genomic KIT editing efficiency (reported in G). Right, % of Fab79D+ cells within total KIT+ cells by control staining with clone 104D2. Unpaired t-test. i Human engraftment by flow cytometry (% hCD45+) in the peripheral blood and BM at week 14 of NBSGW mice xenotransplanted with CD123S59 or AAVS1BE CD34+ HSPCs, in primary (left) or secondary (right) transplants. Comparison by two-way ANOVA, the p-value of the editing effect is reported. j. CD123 editing efficiencies measured on liquid culture (LC), total blood cells at week 8 and 10 after transplant (W8, W10), on FACS-sorted B (CD19) and myeloid (CD33) BM cells at the end of the experiment, and on total BM from secondary recipients. Mean ± SD. One-way ANOVA. k. Representative FACS plots showing CD123 staining with both therapeutic (7G3) and control (9F5) mAb clones on BM lineage-CD34+ cells from secondary xenotransplanted mice. Loss of 7G3 staining in vivo is consistent with the genomic CD123 editing efficiency (reported in J). l. Left, schematic representation of a lentiviral vector encoding for the mNeonGreen fluorescent protein under a hPGK promoter used to transduce human PDXs. Right, representative flow cytometry plots show the transduction efficiency of patient-derived AML xenografts on bone marrow (PDX-1) or spleen (PDX-2) samples. PDX cells were transduced ex vivo overnight, transplanted into NBSGW mice for expansion, FACS-sorted for mNeonGreen+ cells and injected into secondary recipients. m. Genetic features (left) and surface immunophenotype (right) at thawing of AML PDX used for in vivo experiments. Genetic mutations and the % of positive cells for each marker is reported in the heatmap. ITD, internal tandem duplication; TKD, tyrosine kinase domain mutation. n. Effect of cultured, non-CAR-transduced T cells on healthy human engraftment in NBSGW mice. Mice were engrafted with 1M CD34+ HSPCs and treated with 2.5 M healthy donor untransduced T cells, expanded in vitro as previously described. While there is no Ag-specific impact on lineage composition, we observed significant depletion of HSCs (0.08x), slight expansion of monocytes (2.57x) and a trend towards B cell increase. Left, representative FACS plots of lineage-CD34+38-10- progenitors, with HSC gating (CD45RA-90+) highlighted in red. Centre, human BM graft composition as % of hCD45+CD3- (to exclude exogenous T cells). Multiple unpaired t-tests, only significant p values are reported. Right, correlation between T cell expansion (CD3+ w/in hCD45+) and decrease in HSC frequency in mice treated with untransduced T cells.

