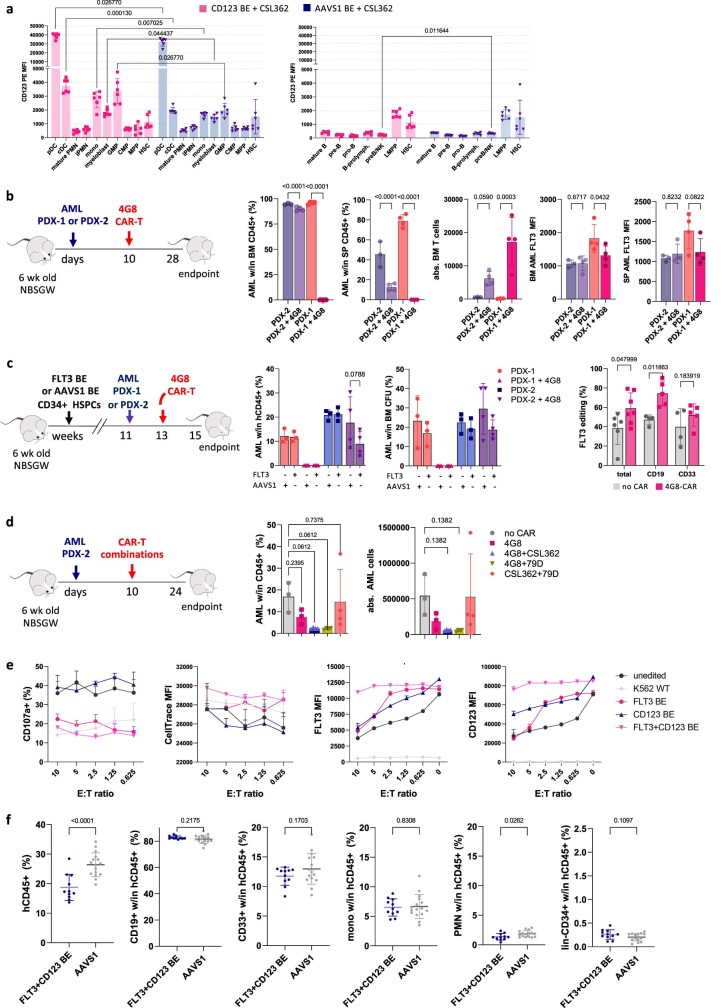
Extended Data Fig. 11. Susceptibility of AML PDX to targeted immunotherapies and improved efficacy of dual-specific CAR-T cells.
a. CD123 expression (MFI) on myeloid (left) and lymphoid (right) BM subsets at the endpoint (experiment reported in Extended Data Fig. 10). Mean ± SD. Statistical differences by multiple unpaired t-test are reported. b. 4G8-CAR deplete PDX-1 in vivo but fail to eradicate PDX-2. NSBGW female mice were xeno-transplanted with AML PDX cells and, after 10 days, treated with 4G8 CAR-T cells. Experimental endpoint was 18 days after CAR-T administration. From left to right, bar plots report the % of AML PDX cells within total CD45+ cells in the bone marrow (BM), % of AML PDX cells within total CD45+ cells in the spleen (SP), absolute counts of BM T cells, the FLT3 MFI on surviving AML cells in the BM and the FLT3 MFI on surviving AML cells in the SP. Mean ± SD. One-way ANOVA with multiple comparison. c. 4G8-CAR T cells deplete PDX-1 in vivo but fail to eradicate PDX-2 in mice pre-engrafted with AAVS1BE and FLT3N399 HSPCs. NBSGW mice were xeno-transplanted with edited HSPCs and, after 11 weeks, injected with PDX-1 or PDX-2 cells. After 10 days, mice were treated with 2.5 M 4G8 CAR-T cells, and the outcome was evaluated after 2 weeks. Left, bar plots reporting the % of AML cells within total BM hCD45+ cells and within CFU assays plated with total BM cells. Mean ± SD. One-way ANOVA with multiple comparison. Right, FLT3 editing efficiency within total BM and FACS-sorted CD33+ and CD19+ subsets. 4G8-CAR deplete non-edited hematopoietic cells, resulting in higher editing efficiencies in the CAR-treated condition. Mean ± SD. Comparisons by t-test. d. Combinations of CAR-T cells have improved efficacy against PDX-2 in vivo. NBSGW mice were xeno-transplanted with 0.75 M PDX-2 cells and, after 10 days, treated with 2.5 M 4G8 CAR or combinations of 4G8 + CSL362, 4G8 + Fab79D or CSL362 + Fab79D CAR T cells (2.5 M each). The outcome was evaluated after 2 weeks. The bar plots show the % and absolute counts of AML cells within total BM hCD45+ cells. Mean ± SD. One-way ANOVA with multiple comparison (vs untreated condition). e. Dual FLT3/CD123 specific CAR-T cell in vitro co-culture assay with single and dual FLT3/CD123 epitope-edited HSPCs (same experiment reported in Fig. 5c). From Left to Right, T cell degranulation (CD107a+, top-right), median fluorescent intensity (MFI) of CellTrace (bottom-left), and FLT3 and CD123 expression (MFI) on target cells (bottom-centre and right). Mean ± SD (N = 4). Statistical comparisons are reported in Supplementary Table 24. f. Peripheral blood lineage composition of NBSGW mice xeno-transplanted with AAVS1BE and dual-edited FLT3N399/CD123S59 HSPCs at 9 weeks (same experiment as Fig. 5D). Mean ± SD. Unpaired t-tests.

