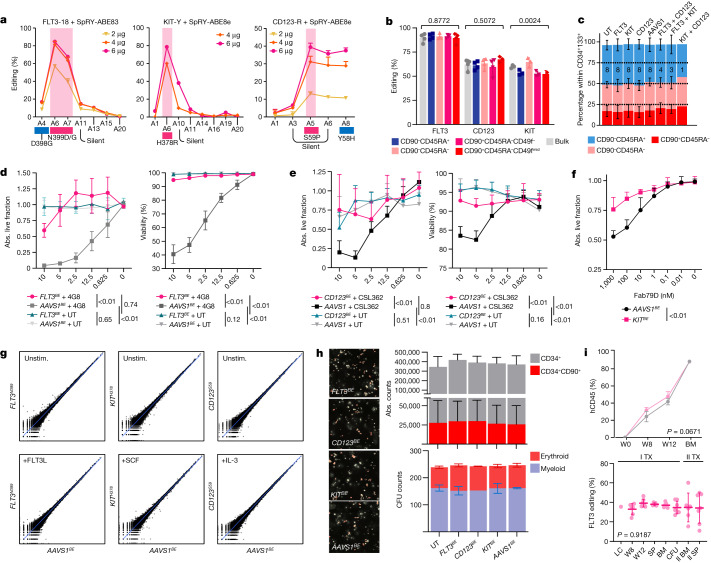
Fig. 3. Epitope editing does not affect stemness and differentiation of HSPCs.
a, The editing windows within FLT3, KIT and CD123 sgRNAs after electroporation with different doses of mRNA. Data are mean ± s.d. b, Editing efficiencies of bulk CD34+ or FACS-sorted subsets. The gating strategy is reported in Supplementary Fig. 2c. n = 4 biological replicates, n = 3 for KIT. Data are mean ± s.d. Statistical analysis was performed using one-way ANOVA. c, The CD90/CD45RA composition of epitope-edited HSPCs measured by FACS analysis within the CD34+CD133+ subset. Data are mean ± s.d. The sample size is reported within the bars. d, In vitro 4G8-CAR killing assay of FLT3N399 edited HSPCs. The fraction of persisting live cells (left) and the viability on the basis of annexin V and 7-AAD staining (right) of CD34+CD45RA+ cells, 48 h after co-culture with 4G8-CAR or untransduced T cells at different effector:target (E:T) ratios. Data are mean ± s.d. n = 4. Statistical analysis was performed using two-way ANOVA. e, In vitro CSL362-CAR killing assay of CD123S59 edited HSPCs. The fraction of persisting live CD90+ cells (left) and the viability of CD34+ cells on the basis of annexin V and 7-AAD staining (right), 48 h after co-culture with CSL362-CAR or untransduced T cells at different E:T ratios. n = 8 on 2 donors. Statistical analysis was performed using two-way ANOVA. f, The fraction of absolute live CD34+ cells (relative to the no-antibody control) of KITH378 or AAVS1BE HSPCs after 48 h of culture with Fab-79D monoclonal antibodies. Data are mean ± s.d. n = 6 on 2 donors. Statistical analysis was performed using two-way ANOVA. g, RNA-seq analysis of epitope-edited CD34+ HSPCs with or without stimulation. log-scale scatter plot of the mean gene expression values of the AAVS1 control and FLT3-, KIT- and CD123-edited cells, either at the baseline (top) or after stimulation with FLT3L, SCF or IL-3 (bottom). n = 3 biological replicates. Unstim., unstimulated. h, The absolute counts of total CD34+ and CD90+CD45RA− cells (n = 4; top right) and of myeloid and erythroid colonies (n = 2; bottom right) of edited HSPCs. Left, representative colony-forming-unit (CFU) microphotographs. i, Primary and secondary xenotransplantation of FLT3N399 or AAVS1BE HSPCs. Top, human engraftment (hCD45+) by flow cytometry analysis in primary recipients. Data are mean ± s.d. Statistical analysis was performed using two-way ANOVA. n = 7 (FLT3N399) and n = 4 (AAVS1BE). Bottom, FLT3 editing was measured on peripheral blood, haematopoietic organs (BM and spleen (SP)) or CFUs in primary and secondary transplants. Data are mean ± s.d. Statistical analysis was performed using one-way ANOVA. LC, liquid culture; SP, spleen; W, week.

