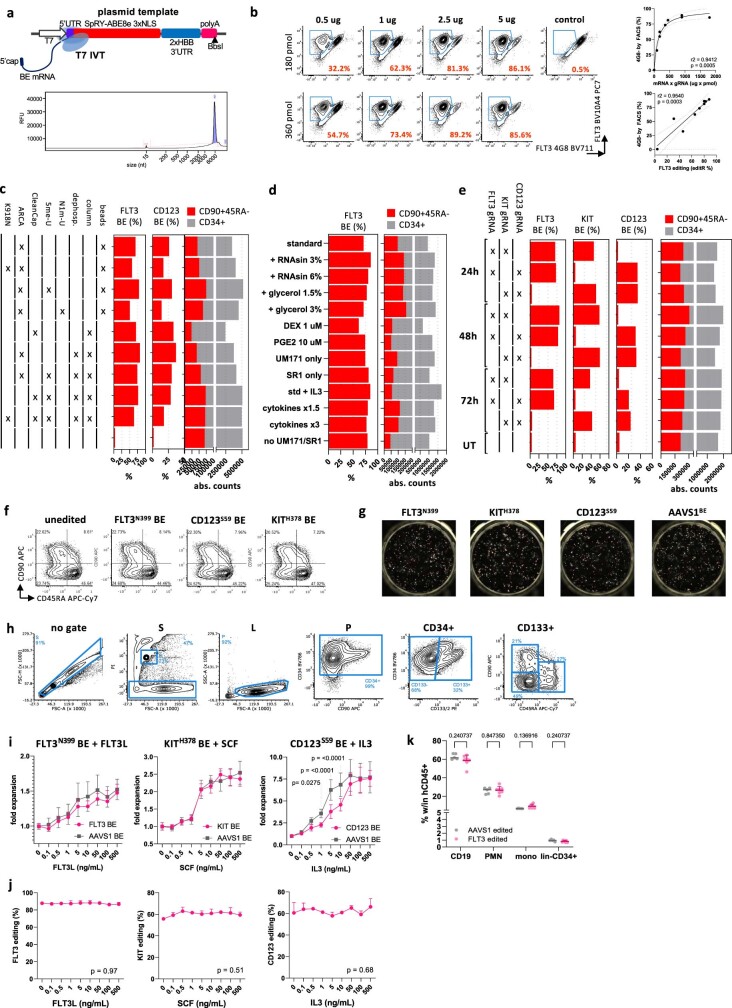
Extended Data Fig. 4. Efficient base editing of FLT3, CD123 and KIT in CD34+ HSPCs.
a. Schematic representation of the plasmid template used for in vitro transcription (IVT) of base editor mRNAs. Type-IIS restriction enzyme BbsI was used to linearize the template. T7, T7 RNA polymerase promoter; UTR, untranslated region; HBB, haemoglobin β gene; polyA, poly-adenine sequence (~110-120 nt). (Bottom) Representative plot of purified IVT SpRY-ABE8e mRNA analysed with Agilent Fragment Analyzer RNA for quality control. >90% of IVT mRNA corresponds to the predicted size. b. SpRY-ABE8e V106W mRNA dose finding test on FLT3-reporter K562 cells base edited for FLT3N399 with sgRNA-18. Right, correlation of FLT3 editing efficiency by flow cytometry with mRNA x sgRNA dose and correlation of FLT3 editing efficiency by flow cytometry and by gDNA analysis. Spearman r2 and p values are reported. c. Optimization of CD34+ HSPC base editing by mRNA electroporation. Several SpRY-ABE8e mRNA variants were tested in a dual FLT3/CD123 editing experiment. Tested variables include: mRNA purification method (beads, sparQ PureMag magnetic beads; column, NEB Monarch RNA columns), dephosphorylation, substitution of UTP with N1-methyl-pseudo-uridine (N1m-U) or 5-methoxy-uridine (5me-U), capping technology (CleanCap, Trilink CleanCap AG; ARCA, NEB 3´-O-Me-m7G(5′)ppp(5′)G RNA Cap Structure Analog) and the addition of the K918N SpCas9 mutation (which has been reported to improve SpCas9 catalytic activity)72. Bar plots showing FLT3 and CD123 editing efficiencies by genomic DNA (gDNA) analysis (%) and absolute counts of bulk (CD34+) and stem-enriched (CD90+45RA-) cells at the end of in vitro culture. d. Optimization of culture conditions for base editing. CD34+ HSPCs were base edited with SpRY-ABE8e mRNA and FLT3N399 sgRNA with addition of supplements during electroporation (RNAsin, Promega RNAsin RNAse-inhibitor; glycerol) or with different culture conditions, including modulation of cytokine concentrations (standard: 100 ng/mL FLT3L, SCF and 50 ng/mL TPO; 1.5x: 150 ng/mL FLT3L, SCF and 75 ng/mL TPO; 3x: 300 ng/mL FLT3L, SCF and 150 ng/mL TPO; + IL-3: standard with addition of hIL-3 20 ng/mL), different stem-cell preserving compounds (standard: SR-1 0.75 μM, UM171 35 nM; SR-1 only 0.75 μM; UM171 only 35 nM; no SR-1/UM171), addition of anti-inflammatory compounds (PGE2, Prostaglandin-E2 10 μM; DEX, dexamethasone 1 μM). Bar plots showing FLT3 editing efficiencies by gDNA analysis (%) and absolute counts of bulk (CD34+) and stem-enriched (CD90+45RA-) cells at the end of in vitro culture. e. CD34+ HSPCs were electroporated at different timepoints (24h, 48h, 72h) after thawing to select the best timing for editing. Each condition was edited once for all combinations of two of our selected targets (FLT3, CD123, KIT). Bar plots show the editing efficiencies by gDNA analysis (%) and absolute counts of bulk (CD34+) and stem-enriched (CD90+45RA-) cells at the end of in vitro culture. f. Representative flow cytometry plots of the stem cell surface phenotype (CD90/CD45RA subsets) of FLT3, CD123, KIT and AAVS1 base edited CD34+ HSPCs. Plots are pre gated on Live CD34+133+ cells. g. Uncropped photomicrograph of colony forming assays plated with in vitro epitope edited CD34+ HSPCs (same conditions as Fig. 3h). h. Representative flow cytometry plots showing the gating strategy used for analysis of edited CD34+ HSPCs. From left to right, cells were gated for singlets (FSC-H/FSC-A plot), Live (PI/FSC-A plot; PI, propidium iodide), physical parameters (SSC-A/FSC-A plot), CD34+ (CD34/CD90 plot), CD133+ (CD34/CD133 plot), and CD45RA-90+, CD45RA-90-, CD45RA+90- (CD45RA/90 plot). After pre-gating on singlets (S), a bead (B) gate identifies CountBeads (FSC-AlowPIhigh, which are further gated on two additional fluorescent parameters to exclude debris (not shown). i. Epitope-edited HSPCs retain proliferative response to cytokine stimulation. FLT3, KIT and CD123 base edited CD34+ HSPCs were plated with different concentration of the respective ligand and cultured for 4 days. Absolute counts were obtained by flow cytometry using CountBeads. Editing efficiencies at experiment endpoint are reported (technical triplicate were pooled together for gDNA analysis). Mean ± SD. N = 4 on 2 healthy donors. Two-way ANOVA, the p-value of significant comparisons at each concentration are reported. j. Editing efficiencies of epitope-edited HSPCs cultured for 4 days with different concentration of the respective receptor ligand (same experiment at Extended Data Fig. 4h). No counterselection of the edited cells was observed. One-way ANOVA. k. BM lineage composition of NBSGW xeno-transplanted with FLT3- or AAVS1-edited HSPCs. Same primary xenotransplant reported in Fig. 3i. Mean ± SD. Multiple t-tests. FLT3N399 N = 7, AAVS1-BE N = 4. PMN, polymorphonucleate granulocytes; mono, monocytes; lin-, lineage-negative.

