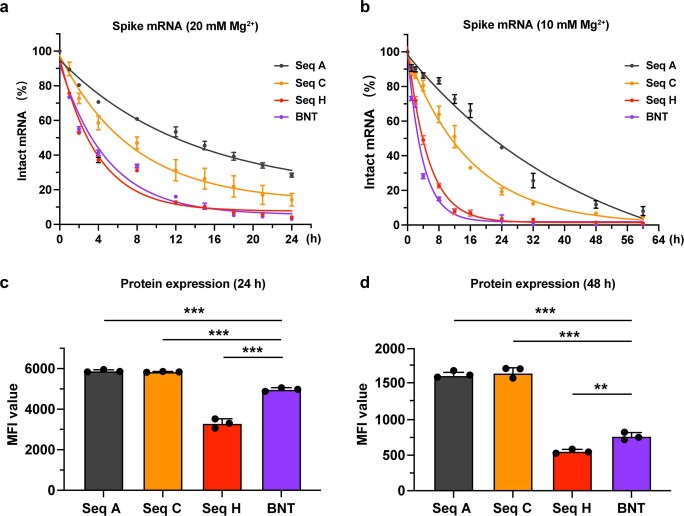
Extended Data Fig. 6. In-solution stability and protein expression of sequences A, C, H and BNT, for a head-to-head in vitro comparison between LinearDesign and BioNTech-Pfizer mRNA sequences.
a-b, In-solution stability of mRNAs in PBS buffer containing 20 mM Mg2+ or 10 mM Mg2+ at 37 °C. Data are from three independent experiments and were presented as mean ± s.d. and fitted with one-phase decay curve. c-d, Protein expression of mRNAs was determined 24 h or 48 h following transfection into HEK293 cells. MFI value is presented as mean ± s.d. Each group has three independent assays and 10,000 live cells were collected for analysis in each assay. Kruskal–Wallis analysis of variance (ANOVA) with Dunn’s multiple comparisons test to BNT group was performed for statistical analysis. **P < 0.01, ***P < 0.001.

