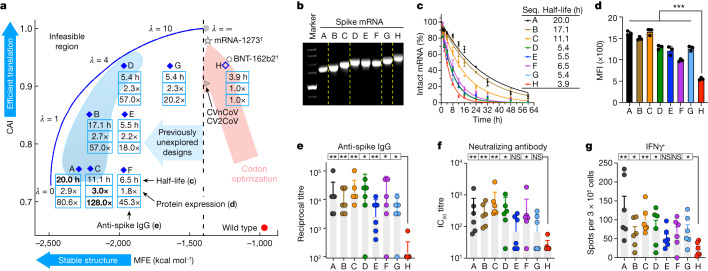
Fig. 4. Experimental evaluation of LinearDesign-generated mRNA sequences encoding SARS-CoV-2 spike protein.
a, Summary of chemical stability of and protein expression from spike mRNA designs A–G and the corresponding immune response (induction of anti-spike IgG) in mice compared to the codon-optimized benchmark H. The vaccines of mRNA-1273 and BNT-162b2 are annotated with daggers, because they use modified nucleotides, but their MFEs here are calculated with the standard energy model. b, Non-denaturing agarose gel characterization of mRNA, showing the correlation of gel mobility with minimum free energy. For gel source data, see Supplementary Fig. 1a. c, Chemical stability of mRNAs upon incubation in 10 mM Mg2+ buffer at 37 °C. Data are from three independent experiments. Seq., sequence. d, Protein expression levels from mRNAs 48 h after transfection into HEK293 cells, as determined by flow cytometry. Mean fluorescence intensity (MFI) values are derived from three independent experiments. Kruskal–Wallis ANOVA with Dunn’s multiple comparisons with the H group. e–g, C57BL/6 mice (n = 6) were immunized intramuscularly with two doses of formulated mRNA with a two-week interval. e, End-point titre of anti-spike IgG. f, Levels of neutralizing antibodies against wild-type SARS-CoV-2. IC50, half-maximal inhibitory concentration. g, Frequencies of IFNγ-secreting T cells, measured by enzyme-linked immunospot (ELISpot) assay. Two-tailed Mann–Whitney U test. Data are mean ± s.d. (c,d), geometric mean ± geometric s.d. (e,f) or mean ± s.e.m. (g). *P < 0.05, **P < 0.01, ***P < 0.001. NS, not significant. See Extended Data Figs. 5–7 and Supplementary Figs. 10 and 12 for extra experimental results and predicted secondary structures, and Supplementary Table 2 for detailed computational and experimental data.

