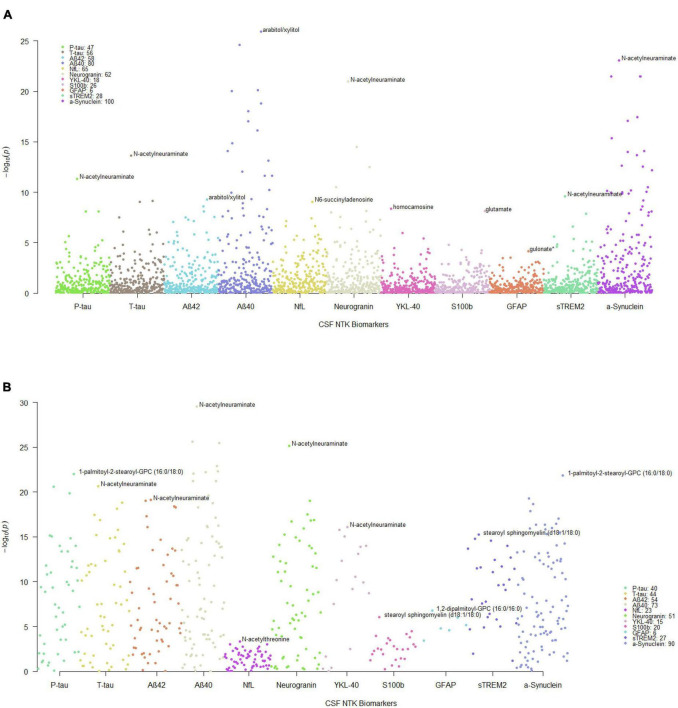
FIGURE 1.
Manhattan plots of MWAS results between CSF metabolites and CSF NTK biomarkers. Each dot represents a metabolite and the different colors represent the CSF NTK biomarkers (x-axis) in (A) WRAP and (B) the Wisconsin ADRC (only significant metabolites after FDR correction in WRAP were included). The –log10(p-value) is shown on the y-axis. The legend box indicates the number of metabolites that were significant after FDR correction for each NTK biomarker. The annotated metabolites in the figures represent the most significant metabolite associated with each NTK biomarker.

