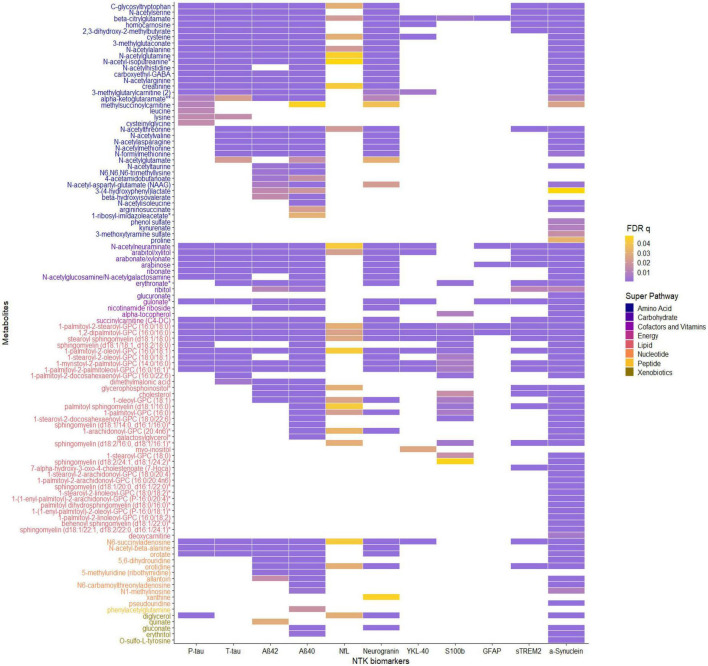
FIGURE 2.
The association patterns between significant CSF metabolites and CSF NTK biomarkers in Wisconsin-ADRC. Each cell represents the association of a CSF metabolite with a biomarker. The color scale indicates the magnitude of the FDR q-values. The metabolites are also grouped and colored based on their super pathway.

