Fig. 2.
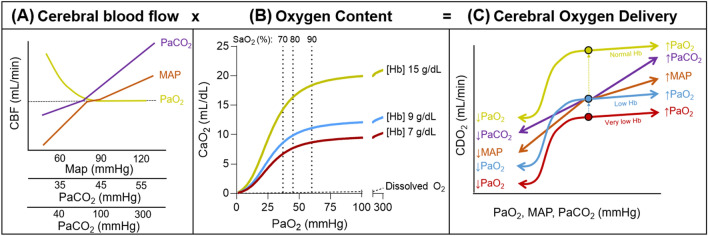
Regulation of cerebral blood flow and convective oxygen delivery. Panel A depicts the relationship between cerebral blood flow (CBF) and mean arterial blood pressure (MAP), the partial pressure of arterial carbon dioxide (PaCO2), and the partial pressure of oxygen (PaO2). During changes in blood pressure, the brain is more effective at combating increases as opposed to decreases in MAP. CBF changes linearly and proportionally to changes in PaCO2 until extreme levels of hypocapnia or hypercapnia. Decreases in PaO2 lead to a curvilinear increase in CBF in conjunction with the curvilinear nature of the oxyhaemoglobin dissociation curve. Panel B depicts the influence of PaO2 and haemoglobin concentration [Hb] on arterial oxygen content (CaO2). Separate lines for [Hb] concentrations are depicted for a haemoglobin concentration of 15 g/dL as well as two Hb thresholds that have been studied as transfusion thresholds in other patient groups in the intensive care unit. The minimal increase in CaO2 that results from supplemental oxygen leading to a PaO2 of up to 300 mmHg is also depicted. Panel C depicts a graphical overview of how increases and decreases in each of the factors depicted in panels A and B influence the overall convective cerebral delivery of oxygen (CDO2)

