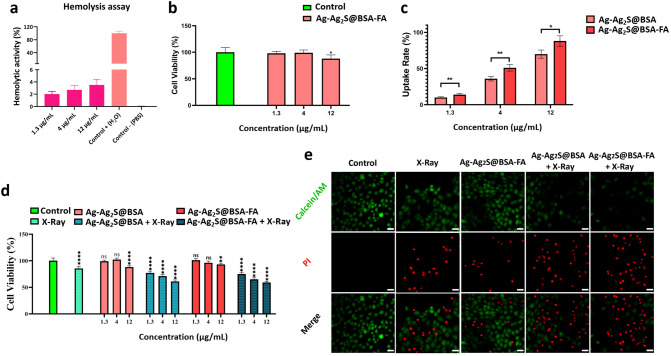
Figure 4.
(a) Percentage of hemolysis of Ag-Ag2S@BSA-FA NPs in different concentrations; (b) Cytotoxicity of Ag-Ag2S@BSA-FA NPs on healthy HFF2 cells; (c) Uptake rate of Ag-Ag2S@BSA-FA-FITC and Ag-Ag2S@BSA-FITC NPs by 4T1 cells analyzed by flow cytometry; (d) Cell viability of 4T1 cells under different treatment procedures in the presence and absence of X-ray irradiation (4 Gy) and NPs; (e) 4T1 cells images stained with calcein-AM and PI in the presence and absence of X-ray radiation after different treatments. (Scale bar is 20 µm). Data = mean ± SD; Sign “ns” *, **, ***, and **** show no significant difference, and significant difference with p ≤ 0.05, p ˂ 0.01, p ˂ 0.001 and p ˂ 0.0001, respectively, compared to the control group.

