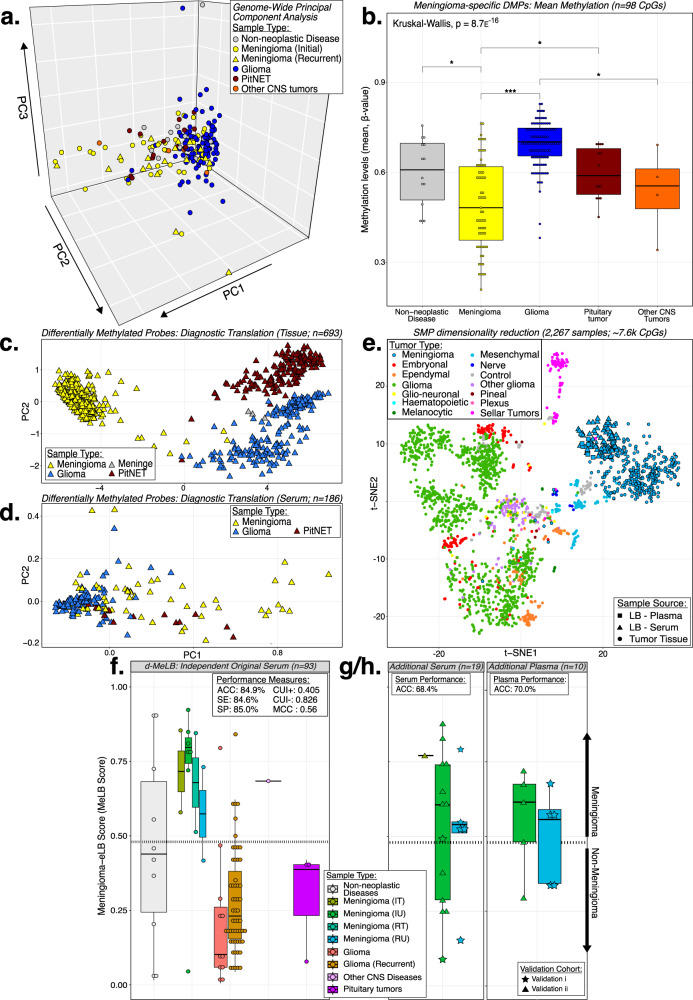
Fig. 1. Serum circulating cell-free DNA methylation patterns and signatures distinguish meningiomas from other CNS entities.
a Principal component analysis (PCA) depicting the genome-wide mean methylation levels of serum cfDNA derived from patients with meningioma (MNG; n = 63) and non-MNG conditions (other CNS entities and non-neoplastic diseases; n = 141). Note: MNG: meningiomas; CNS Central Nervous System. b Mean methylation levels of the differentially methylated CpG probes (DMP, n = 98) across comparisons between MNG and non-MNG (Wilcoxon rank sum test; Kruskal-Wallis; *p < 0.05, **p < 0.01, ***p < 0.001). Box plots - data are presented as median and upper (75%) and lower (25%) quartiles. Whiskers represent minimum to maximum values, excluding outliers. Exact p-values: Meningioma vs Non-neoplastic Disease: p = 0.018; Meningioma vs Glioma: p = 4.4e−16; Meningioma vs pituitary neuroendocrine tumors: p = 0.017; Glioma vs Other CNS tumors: p = 0.012. Note: DMP: differentially methylated probes. t-distributed stochastic neighbor embedding (t-SNE) plots displaying clustering of meningioma-specific DMPs across MNG and non-MNG tissue specimens (c). A subset of these DMPs is detected in the serum and also distinguish equivalent groups (d). e t-SNE plot displaying dimension-reduced diagnostic-Meningioma Epigenetic Liquid Biopsy (d-MeLB) probes (SMP: n = 18k CpGs) across CNS tumor tissue, liquid biopsy (serum and plasma) and tumor tissue from patients with MNG. SMP similarly methylated probes, LB liquid biopsy. Distribution of the d-MeLB scores across independent cohorts (f: original liquid biopsy serum, n = 93; g: additional MNG serum, n = 19; h: additional MNG plasma, n = 10) (Dashed line: MeLB cutoff score). Box plots - data are presented as median and upper (75%) and lower (25%) quartiles. Whiskers represent minimum to maximum values, excluding outliers. Upper left corner: performance measures. ACC Accuracy, SE Sensitivity, SP Specificity, CUI Clinical Utility Index, MCC Matthew’s Correlation Coefficient, IT initial treated, IU initial untreated, RT recurrent treated, RU recurrence untreated.

