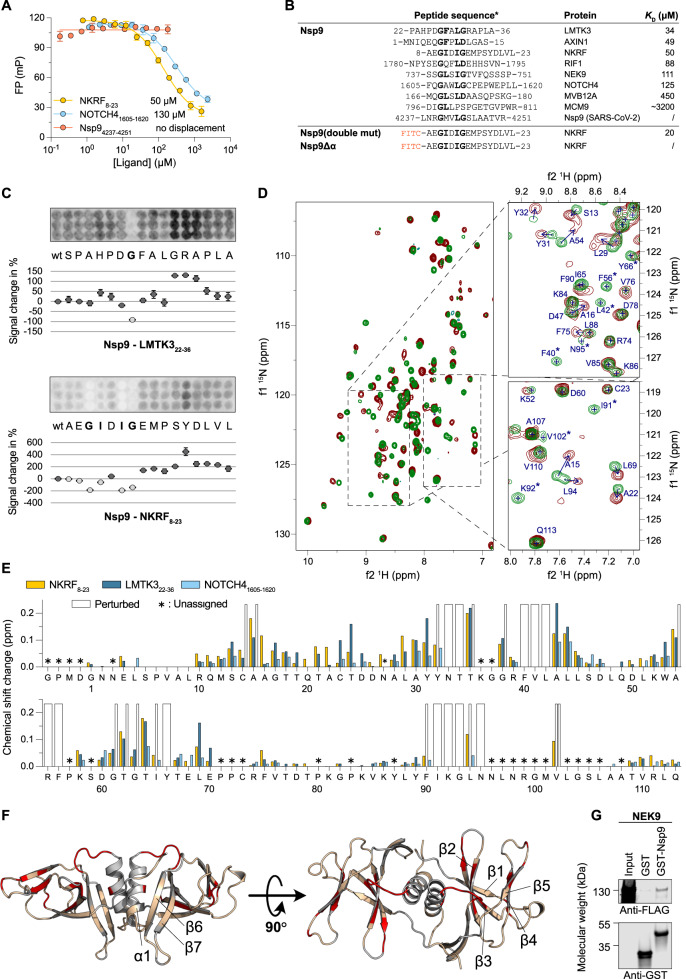
Fig. 5. Interactions between Nsp9 and human peptide ligands are mediated by a GΦxΦ[GDP] motif and lead to rearrangement of the hydrophobic core of Nsp9.
A Representative FP-monitored displacement experiments measuring the affinity between Nsp9, two human peptide ligands and a peptide from Nsp9 with the motif. Affinities are shown next to each peptide. The data are presented as means ± SD. (N = 3) B Alignment of peptides identified by ProP-PD for which the affinities were measured. Residues, corresponding to the identified GΦxΦ[GDP] motif are shown in bold. For Nsp9Δα we did not observe saturation with the FITC-NKRF8–23 peptide. C SPOT array alanine scans for the indicated peptides. Signal intensities were normalized to wild type (wt) and presented as percentage signal change (mean ± SD, N = 3). D HSQC experiments showing the 1H-15N peak shifts. The left panel shows the superposition of Nsp9 protein (green) and Nsp9 mixed with NKRF peptide (wine red). The right panels show representative examples of the observed chemical peak shift perturbations. The arrows indicate the directions of the chemical shift change, and the asterisk indicates that the peaks disappeared after addition of the peptide, indicating a large perturbation of the chemical environment. The full spectra are shown in Supplementary Fig. 10. Numbering is according to the start of Nsp9 after proteolytic processing. E Chemical shift changes of each residue upon the addition of peptide ligands. Perturbed means that the peak disappeared upon the addition of the ligand indicating large effect. Asterisk denotes residues which could not be unambiguously assigned. F Representation of the residues which displayed large change in chemical shift after addition of the NKRF8–23 peptide, as observed by NMR experiments. Residues that changed more than one standard deviation above the average are colored in red, the residues below this threshold are beige, and the residues whose peak shifts could not be unambiguously assigned are gray. The PDBid: 6wxd model of Nsp9 dimer was used for visualization. G The interaction between the full length NEK9 and GST-tagged Nsp9 by pull-down experiments, visualized by western blot. GST-tag alone was used as negative control (two independent experiments).

