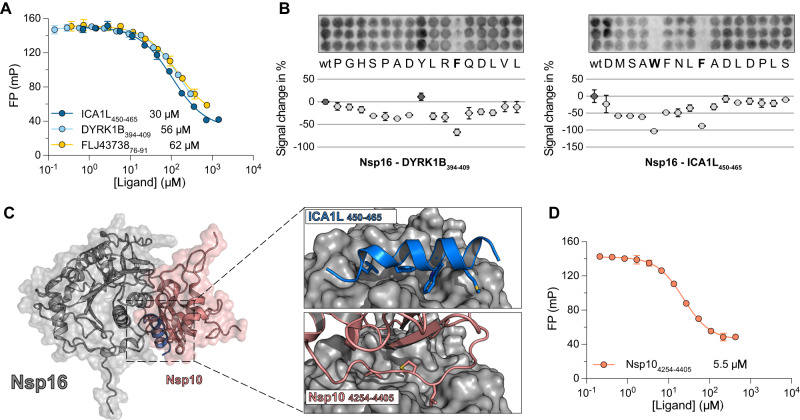
Fig. 6. Peptides identified with ProP-PD directly compete with Nsp10 for binding to Nsp16.
A Displacement experiments measuring affinity between Nsp16, and three peptide ligands derived from human proteins. KD values are shown next to each peptide. The data are presented as means ± SD (N = 3). B SPOT array alanine scans for the DYRK1B395–410 and ICA1L450–465 peptides. Residues involved in binding are shown in bold. Signal intensities were normalized to wild type (wt) and presented as percent signal change (mean ± SD, N = 3). C ColabFold structural predictions for the interaction between Nsp16 (gray), and the ICA1L450–465 peptide (blue). The predicted structure is superimposed onto the crystal structure of the Nsp16-Nsp10 complex (PDBid: 7jyy). The right panels show a magnified view of the peptide binding pocket highlighting the similarities of the Nsp16 binding to the peptide or Nsp10, respectively. The pIDDT score for the ICA1L450–465 peptide was ~60 (see Supplementary Fig. 13). D FP-monitored displacement by Nsp10 of a complex between Nsp16 and FITC-DYRK1B394–409 shows that Nsp10 and the peptide binds to the same surface of Nsp16. The KD value for the Nsp10-Nsp16 interaction is indicated. The data are presented as means ± SD (N = 3).

