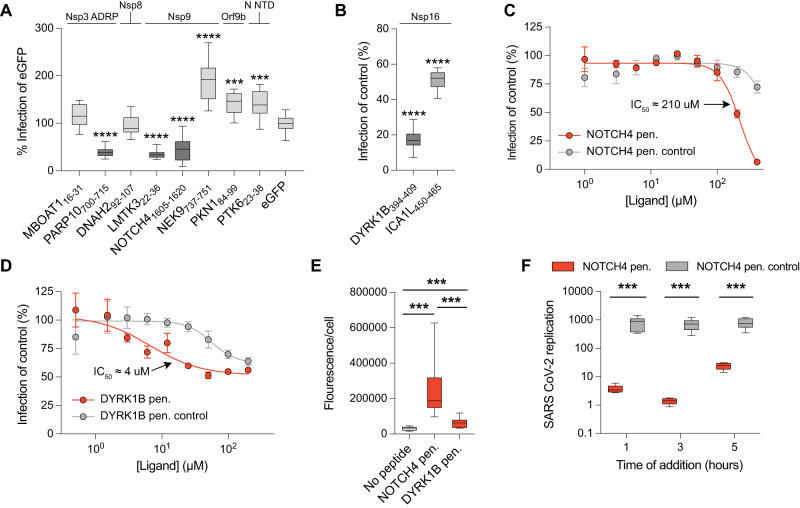
Fig. 7. Inhibition of SARS-CoV-2 viral infection propagation by lentiviral constructs or cell penetrating peptides.
A Inhibition is shown as percent infection of eGFP. Highlighted columns represent constructs, that showed significant inhibition. The target proteins of SARS-CoV-2 are stated above. Significance was determined using a two-sided unpaired t-test; *p < 0.05, **p < 0.01, ***p < 0.001, and ****p < 0.0001. Data are presented as box plots with mean, minimum, maximum, and interquartile range (N = 12). B Inhibitions by lentiviral constructs expressing Nsp16-targeting peptides are shown as percent infection of control. In the control construct the key interacting residues are mutated to alanine. A complete list of the lentiviral constructs can be found in Supplementary Data 7. Significance was determined same way as in (A). Data are presented as box plots with mean, minimum, maximum, and interquartile range (N = 9). C A serial dilution of either the cell penetrating NOTCH4 peptide (NOTCH4 pen.; red dots) or the cell penetrating NOTCH4 control peptide (NOTCH4 pen. control; gray dots) was added to SARS-CoV-2 infected VeroE6 cells. The IC50 for the cell penetrating NOTCH4 peptide is indicated. Data is represented as mean ± SEM (N ≥ 3; see Source Data for exact number of replicates for each peptide concentration). D The same experiment was repeated but with either the cell penetrating DYRK1B peptide (red dots) or the cell penetrating DYRK1B control peptide (gray dots). Data is represented as mean ± SEM (N = 3 for 0.5 μM, 1 μM, 100 μM and 200 μM and N = 6 for all other peptide concentrations). E Uptake of the Tat-tagged peptides. Total Tat fluorescence per cell. Data are cumulative of 12 stitched images (cell numbers: No peptide, N = 821, DYRK1B, N = 891, NOTCH4, N = 624) and is presented as box plots with mean, minimum, maximum, and interquartile range. Statistical significance was determined using GraphPad prism and a two-sided unpaired t test; ***p < 0.001. F SARS CoV-2 replication in VeroE6 cells treated with 300 μM NOTCH4 pen. or NOTCH4 pen. control peptides. RNA replication is presented as fold induction compared to input. Data are cumulative from two independent experiments done in triplicates (N = 6) and are presented as box plots with mean, minimum, maximum, and interquartile range. Statistical significance was determined using GraphPad prism and a two-sided unpaired t test; ***p < 0.001.

