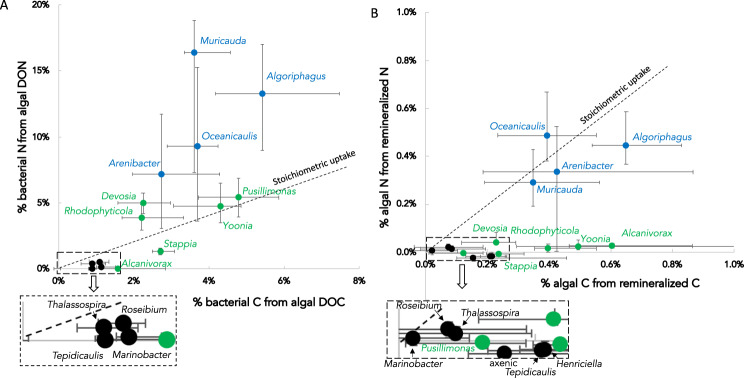
Fig. 1. Bacterial and algal C and N incorporation as measured by stable isotope incubations followed by nanoSIMS.
(A) relationship between C and N net incorporation for 15 Phaeodactylum-associated bacterial taxa (each point is the population median, error bars represent interquartile range; R2 = 0.55; n = 425 total cells). Taxa are colored blue, green, and black based on Kmeans clustering of the SIP data. (B) same relationship for algal incorporation of bacteria-remineralized C and N from the same experiments (median +/- interquartile range; n = 930 cells).

