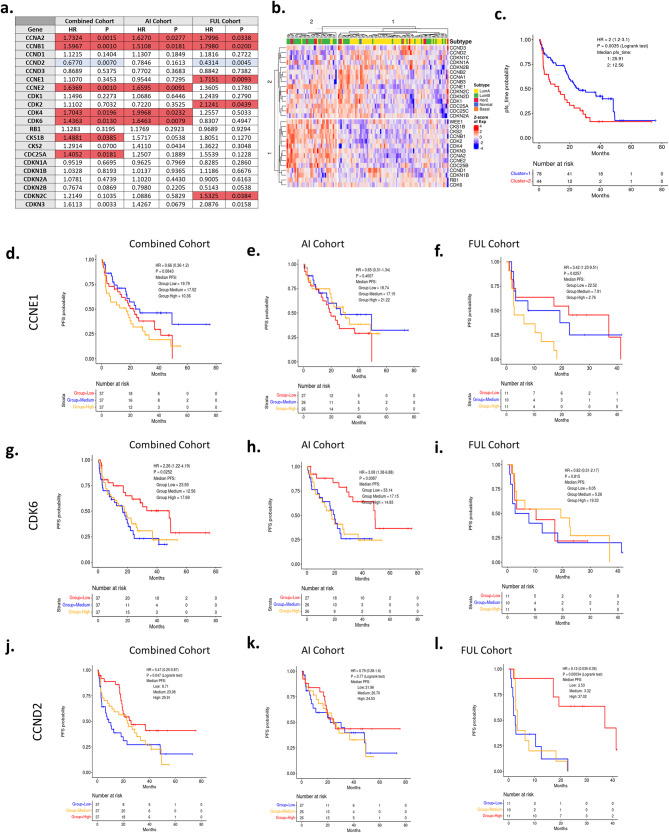
Fig. 7. PFS with CDK regulatory genes.
a Table summarizing association of PFS with major cell cycle genes across cohorts of patients. b Heatmap showing expression of these genes across pretreatment biopsies. This unsupervised clustering is able to stratify luminal A patients from other subtypes (mainly luminal B). c Kaplan–Meier plot showing progression-free survival difference between the two groups stratified by unsupervised clustering. p = 0.0035 by log rank test. d–l Testing for power of single genes in stratifying patients for progression-free survival using gene expression data from pretreatment biopsies. For CCNE1 in the combined, AI, and FUL cohorts, p = 0.0843, p = 0.4007, and p = 0.0257 by log rank test, respectively. For CDK6 in the combined, AI, and FUL cohorts, p = 0.0252, p = 0.0087, and p = 0.815 by log rank test, respectively. For CCND2 in the combined, AI, and FUL cohorts, p = 0.047, p = 0.77, and p < 0.001 by log rank test, respectively.

