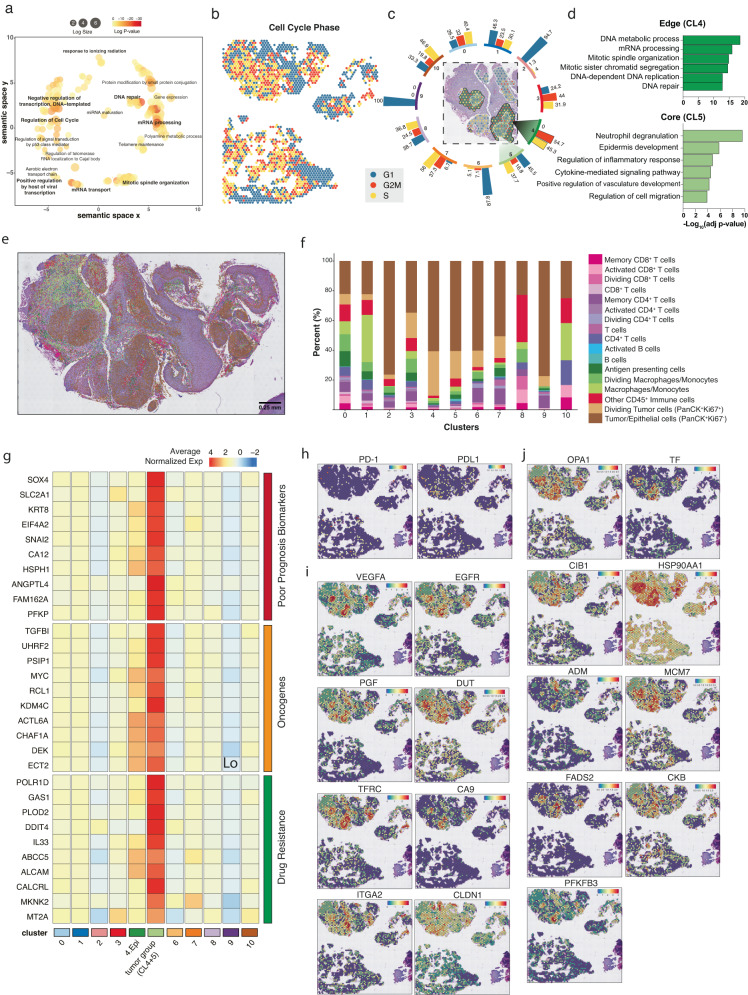
Fig. 2. Transcriptional and functional profiles of the tumor microenvironment interface.
a Common GO terms enriched in all tumor-annotated spots based on DEGs relative to all other clusters. b Cell cycle states of each spot within MAR21 OPSCC and healthy paired samples. Teal, red, and yellow represent spots in G1, G2/M, and S phase, respectively. c Displays the proportions of spots in each cell cycle phase for each Visium defined cluster. Teal, red, and yellow bars represent G1, G2/M, and S phase, respectively. Distinct tumor regions (cluster 4 and 5) are out-lighted in cluster-matched shades of green (dark green: cluster 4; light green: cluster 5). d Gene ontology terms specifically enriched in each tumor cluster. Significant GO terms were generated based on DEGs between distinct cancer clusters, newly defined Visium clusters 4 (dark green) and 5 (light green). Negative log transformed adjusted p-values were calculated using the Benjamini-Hochberg Procedure. e Single-cell resolution of cell types within the MAR21 sample based on integrated PhenoCycler data. Cell phenotype was based on co-expression of marker antibodies. f Stacked bar graphs highlight the percentage of different PhenoCycler cell subtypes observed within each Visium cluster. Colors are paired to indicate similar cell types (e.g., pink and purple are T cell subtypes, blue shades are B-cell subtypes). g Functional classification of DEGs (Wilcoxon test p-value < 0.001) of the combined tumor clusters relative to all other clusters and at least 2-fold overexpressed (CL4 and CL5). Relative expression of poor prognosis markers (red), oncogenes (orange), and drug resistance genes (green) across each cluster. The top 9 genes of each category were displayed. Cluster ‘4.Epi’ represents the sub-cluster 4 annotated as epithelial tissue, and ‘tumor group’ represents the carcinoma annotated spots from cluster 4 and 5 combined. Colors gradient represents average normalized expression values across all spots in each cluster, which were z-transformed by genes (rows of the heatmap). h Spatial expression of PD-1/PD-L1 encoding genes across each spot. i Spatial expression of genes targeted by current clinical therapies for various cancer types. j Spatial expression of experimental targets informed by preclinical studies. In all feature plots, the relative gene expression per spot is indicated by the colored scale bars. Both clinical and preclinical druggable targets were identified based on genes significantly overexpressed (Wilcoxon test p-value < 0.001 and >2-fold change) within the grouped tumor clusters.

